Publication
Metrics
AI Quick Summary
This study constructs a machine learning model using bagged regression trees to predict Martian ionospheric electron density, showing superior performance compared to existing models, MIRI and NeMars, in estimating peak electron density and density height.
Paper Preview
Abstract
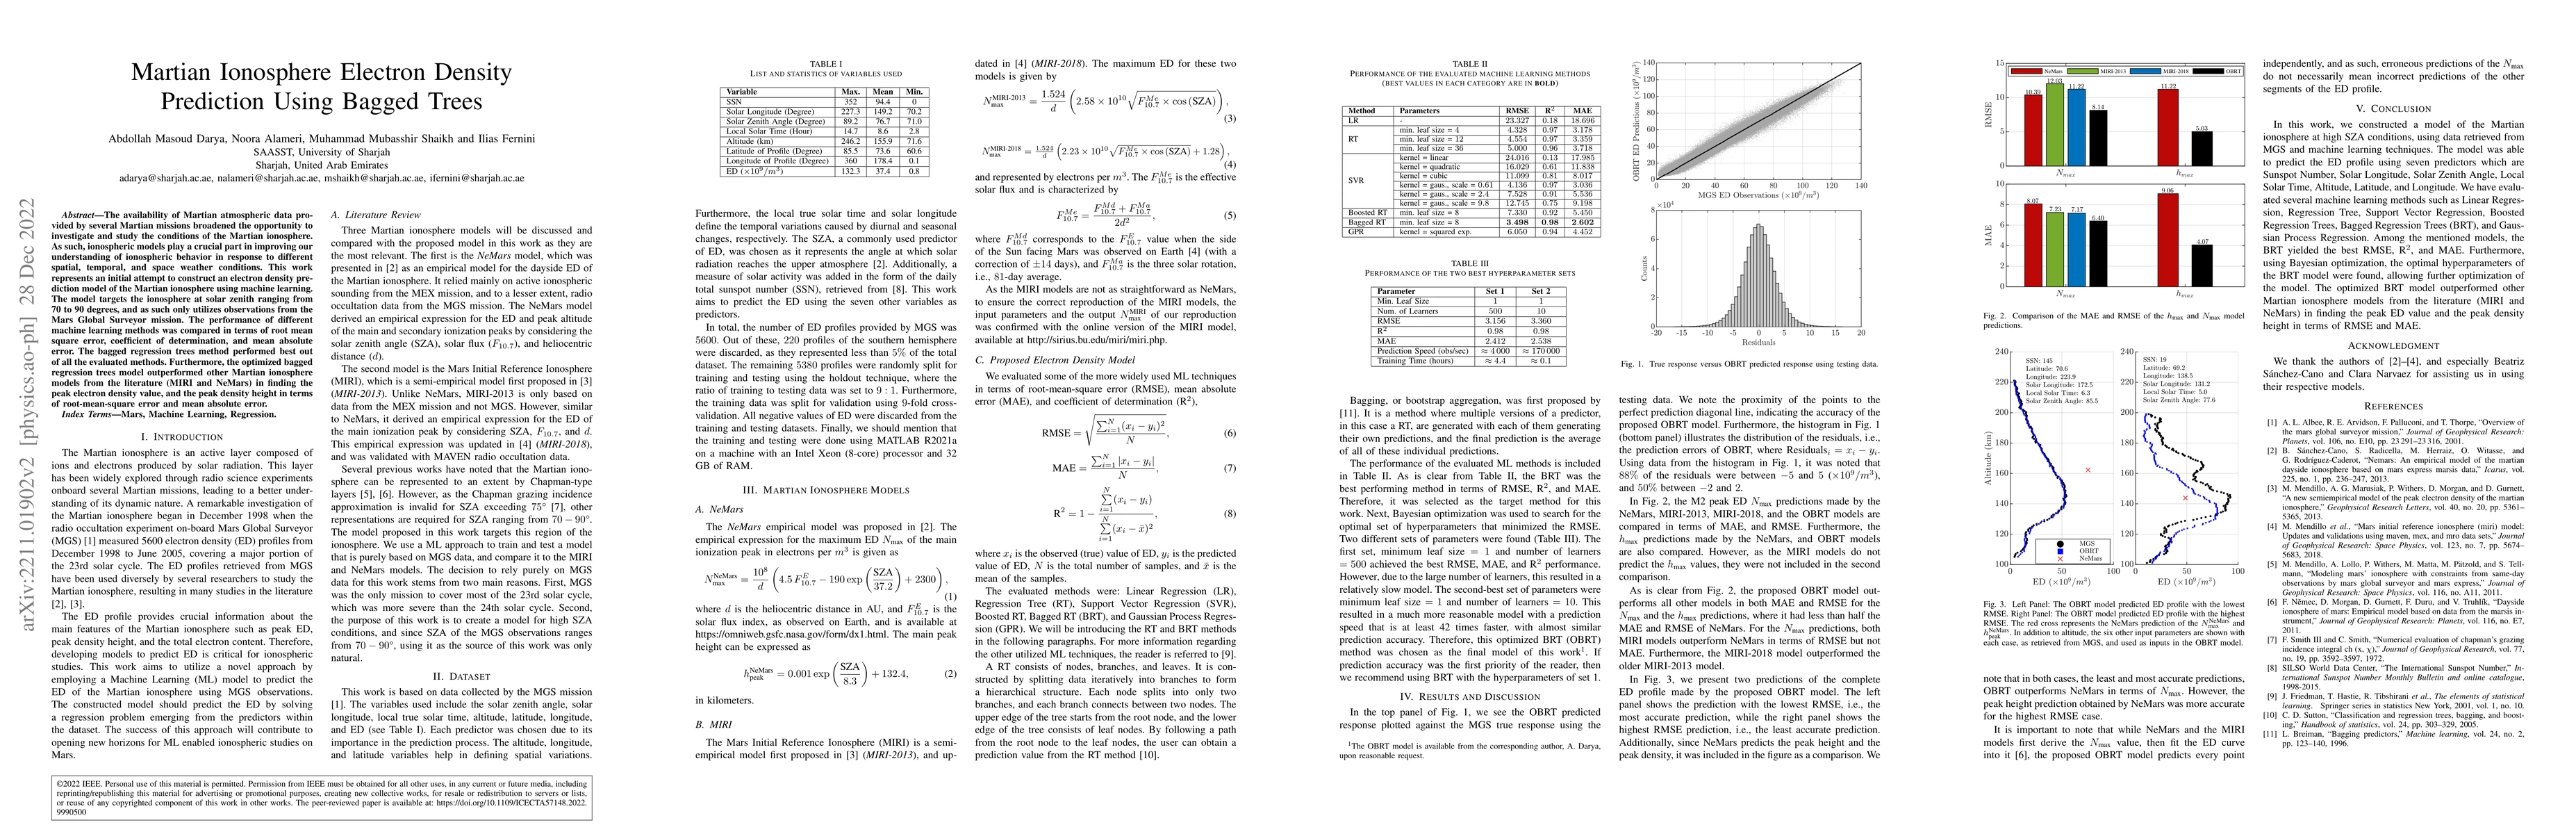
The availability of Martian atmospheric data provided by several Martian missions broadened the opportunity to investigate and study the conditions of the Martian ionosphere. As such, ionospheric models play a crucial part in improving our understanding of ionospheric behavior in response to different spatial, temporal, and space weather conditions. This work represents an initial attempt to construct an electron density prediction model of the Martian ionosphere using machine learning. The model targets the ionosphere at solar zenith ranging from 70 to 90 degrees, and as such only utilizes observations from the Mars Global Surveyor mission. The performance of different machine learning methods was compared in terms of root mean square error, coefficient of determination, and mean absolute error. The bagged regression trees method performed best out of all the evaluated methods. Furthermore, the optimized bagged regression trees model outperformed other Martian ionosphere models from the literature (MIRI and NeMars) in finding the peak electron density value, and the peak density height in terms of root-mean-square error and mean absolute error.
AI Key Findings
Get AI-generated insights about this paper's methodology, results, significance, and more — seven facets brought into focus.
Impact
Paper Details
Authors
PDF Preview
Key Terms
Citation Network
Current paper (gray), citations (green), references (blue)
Display is limited for performance on very large graphs.
Discussion 0