Summary
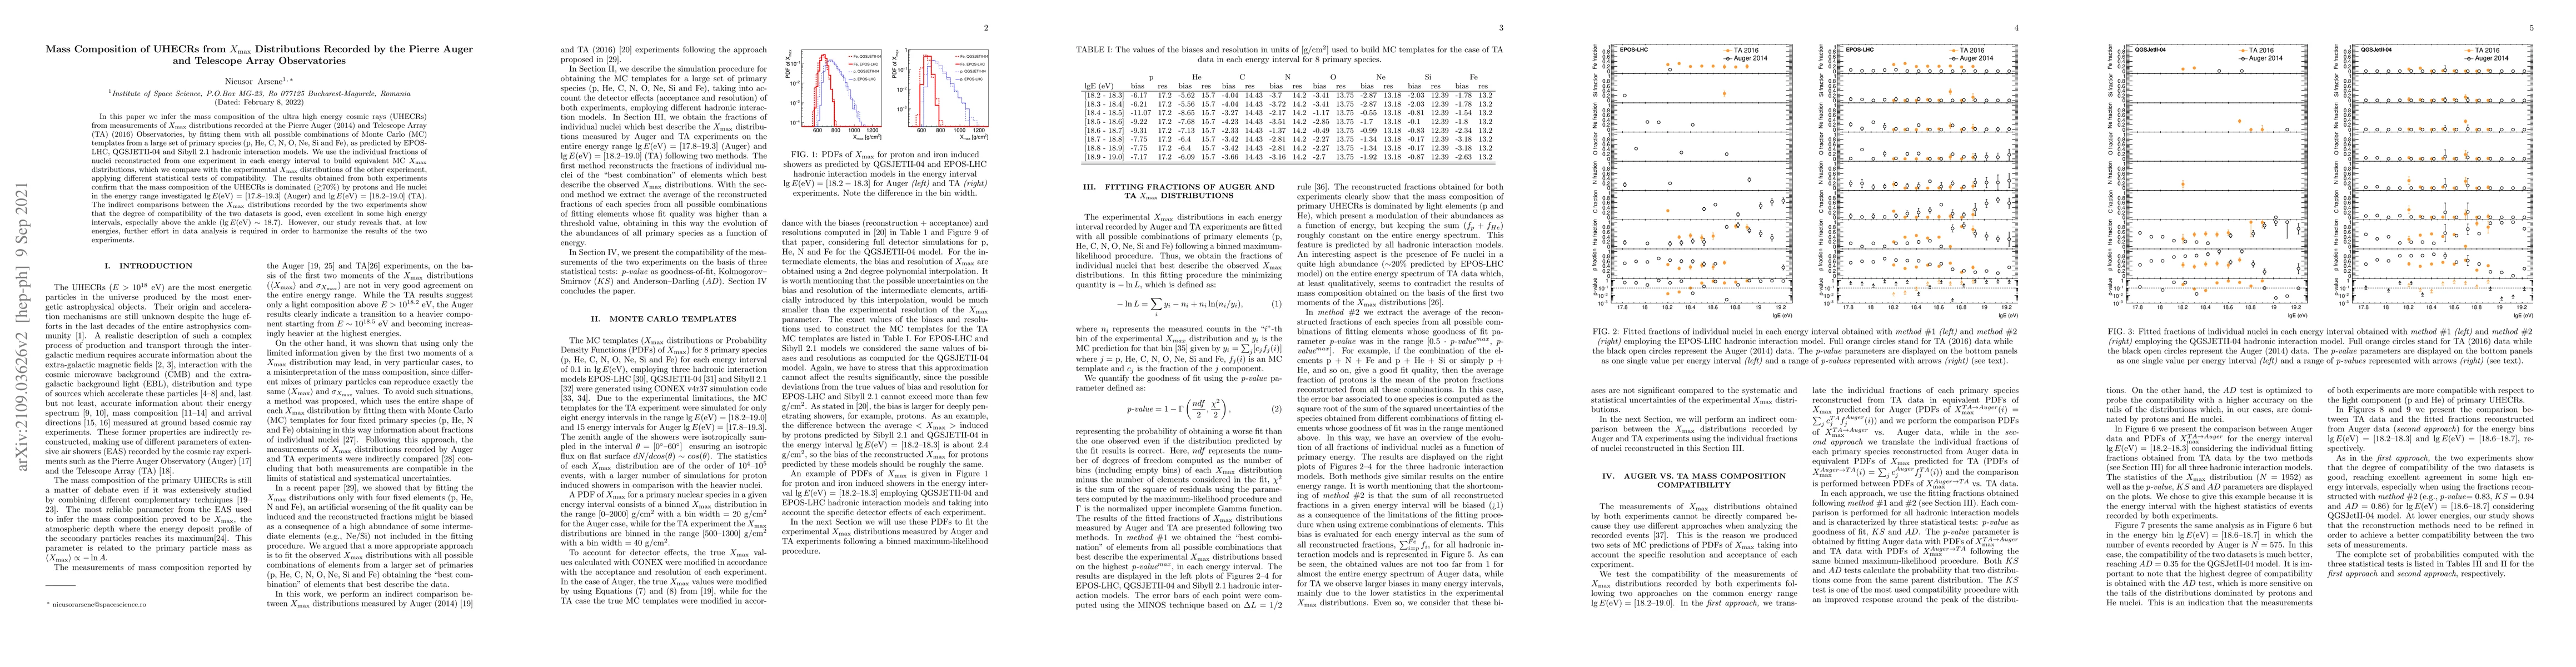
In this paper we infer the mass composition of the ultra high energy cosmic rays (UHECRs) from measurements of $X_{\rm max}$ distributions recorded at the Pierre Auger (2014) and Telescope Array (TA) (2016) Observatories, by fitting them with all possible combinations of Monte Carlo (MC) templates from a large set of primary species (p, He, C, N, O, Ne, Si and Fe), as predicted by EPOS-LHC, QGSJETII-04 and Sibyll 2.1 hadronic interaction models. We use the individual fractions of nuclei reconstructed from one experiment in each energy interval to build equivalent MC $X_{\rm max}$ distributions, which we compare with the experimental $X_{\rm max}$ distributions of the other experiment, applying different statistical tests of compatibility. The results obtained from both experiments confirm that the mass composition of the UHECRs is dominated ($\gtrsim$$70\%$) by protons and He nuclei {in the energy range investigated $\lg E (\rm eV)$ = [17.8--19.3] (Auger) and $\lg E \rm (eV)$ = [18.2--19.0] (TA).} The indirect comparisons between the $X_{\rm max}$ distributions recorded by the two experiments show that the degree of compatibility of the two datasets is good, even excellent in some high energy intervals, especially above the ankle ($\lg E (\rm eV) \sim 18.7$). However, our study reveals that, at low energies, further effort in data analysis is required in order to harmonize the results of the two experiments.
AI Key Findings
Get AI-generated insights about this paper's methodology, results, and significance.
Paper Details
PDF Preview
Key Terms
Citation Network
Current paper (gray), citations (green), references (blue)
Display is limited for performance on very large graphs.
Similar Papers
Found 4 papers| Title | Authors | Year | Actions |
|---|
Comments (0)