Summary

Manifolds are complex topological spaces that can be used to represent datasets of real-world measurements. Visualizing such manifolds can help with illustrating their topological characteristics (e.g., curvature) and providing insights into important properties of the underlying data (e.g., anomalies in the measurements). In this paper, we describe a new methodology and system for generating and visualizing manifolds that are inferred from actual Internet latency measurements between different cities and are projected over a 2D Euclidean space (e.g., a geographic map). Our method leverages a series of graphs that capture critical information contained in the data, including well-defined locations (for vertices) and Ricci curvature information (for edges). Our visualization approach then generates a curved surface (manifold) in which (a) geographical locations of vertices are maintained and (b) the Ricci curvature values of the graph edges determine the curvature properties of the manifold. The resulting manifold highlights areas of critical connectivity and defines an instance of "Internet delay space" where latency measurements manifest as geodesics. We describe details of our method and its implementation in a tool, which we call Matisse, for generating, visualizing and manipulating manifolds projected onto a base map. We illustrate Matisse with two case studies: a simple example to demonstrate key concepts, and visualizations of the US public Internet to show Matisse's utility.
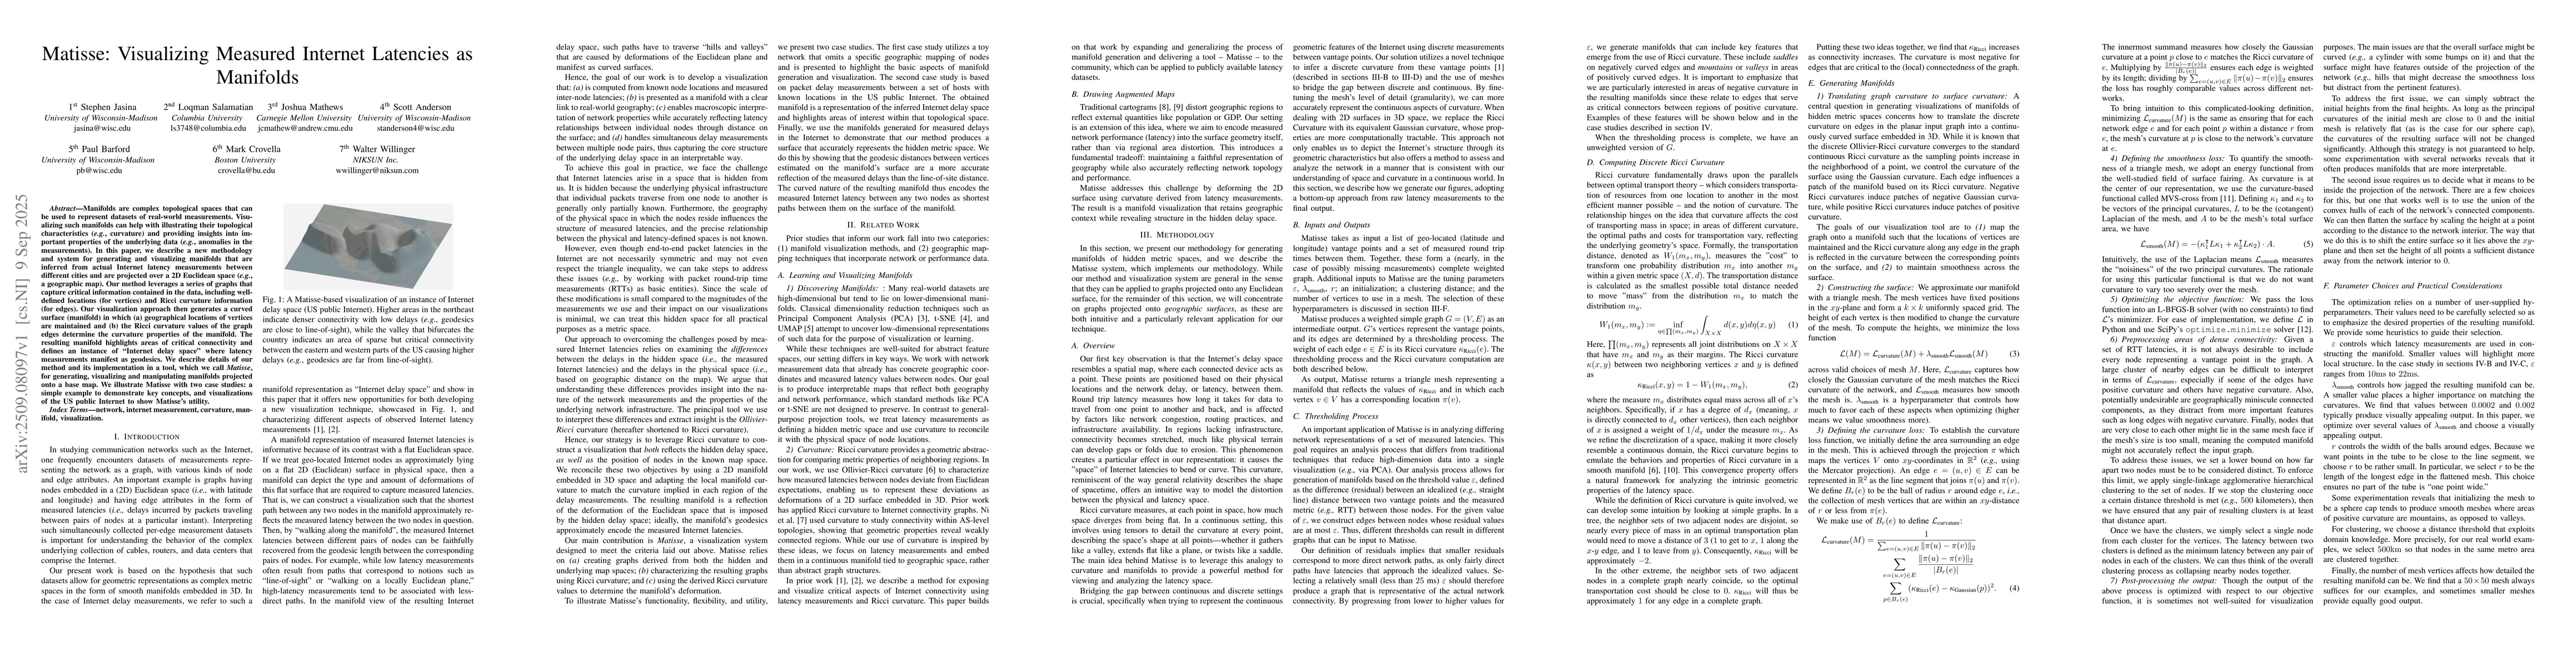
AI Key Findings

Generated Nov 02, 2025

Methodology

The research employs a manifold learning approach to model internet delay spaces, integrating geodesic distances with measured round-trip times (RTTs) using a combination of curvature-based optimization and graph embedding techniques.

Key Results

  • The method successfully maps measured RTT data to geodesic distances on a manifold, revealing regional connectivity patterns in the US and European internet infrastructures.
  • The visualization highlights topographical constraints affecting fiber-optic deployment, such as the Rocky Mountains and Southern US regions.
  • The approach demonstrates stability of geodesic distances over time, showing consistent connectivity patterns across weeks.

Significance

This research provides a novel way to analyze and visualize large-scale internet delay data, offering insights into network topology and infrastructure limitations that could inform future network planning and optimization.

Technical Contribution

A novel curvature-based manifold learning framework that combines geodesic distance computation with RTT measurements to create a continuous, interpretable representation of internet delay spaces.

Novelty

This work introduces the first integration of Ricci curvature optimization with graph embedding techniques for internet delay modeling, enabling both quantitative analysis and visual exploration of network connectivity patterns.

Limitations

  • The computational runtime is substantial, requiring optimization for real-time applications.
  • The method relies on high-quality, geographically distributed measurement data which may not be universally available.

Future Work

  • Implementing the method in compiled languages to improve performance.
  • Expanding the analysis to other regions and network types.
  • Integrating real-time data streaming for dynamic network monitoring.

Paper Details

PDF Preview

Download PDF

Comments (0)

This website uses cookies to ensure you get the best experience. Learn more