Matrix Profile for Anomaly Detection on Multidimensional Time Series
Publication
Metrics
AI Quick Summary
This paper investigates the extension of the Matrix Profile (MP) for anomaly detection in multidimensional time series, proposing strategies to condense the n x n x d tensor into a profile vector. It benchmarks the multidimensional MP against 19 baseline methods, showing consistent high performance across unsupervised, supervised, and semi-supervised learning setups.
Paper Preview
Abstract
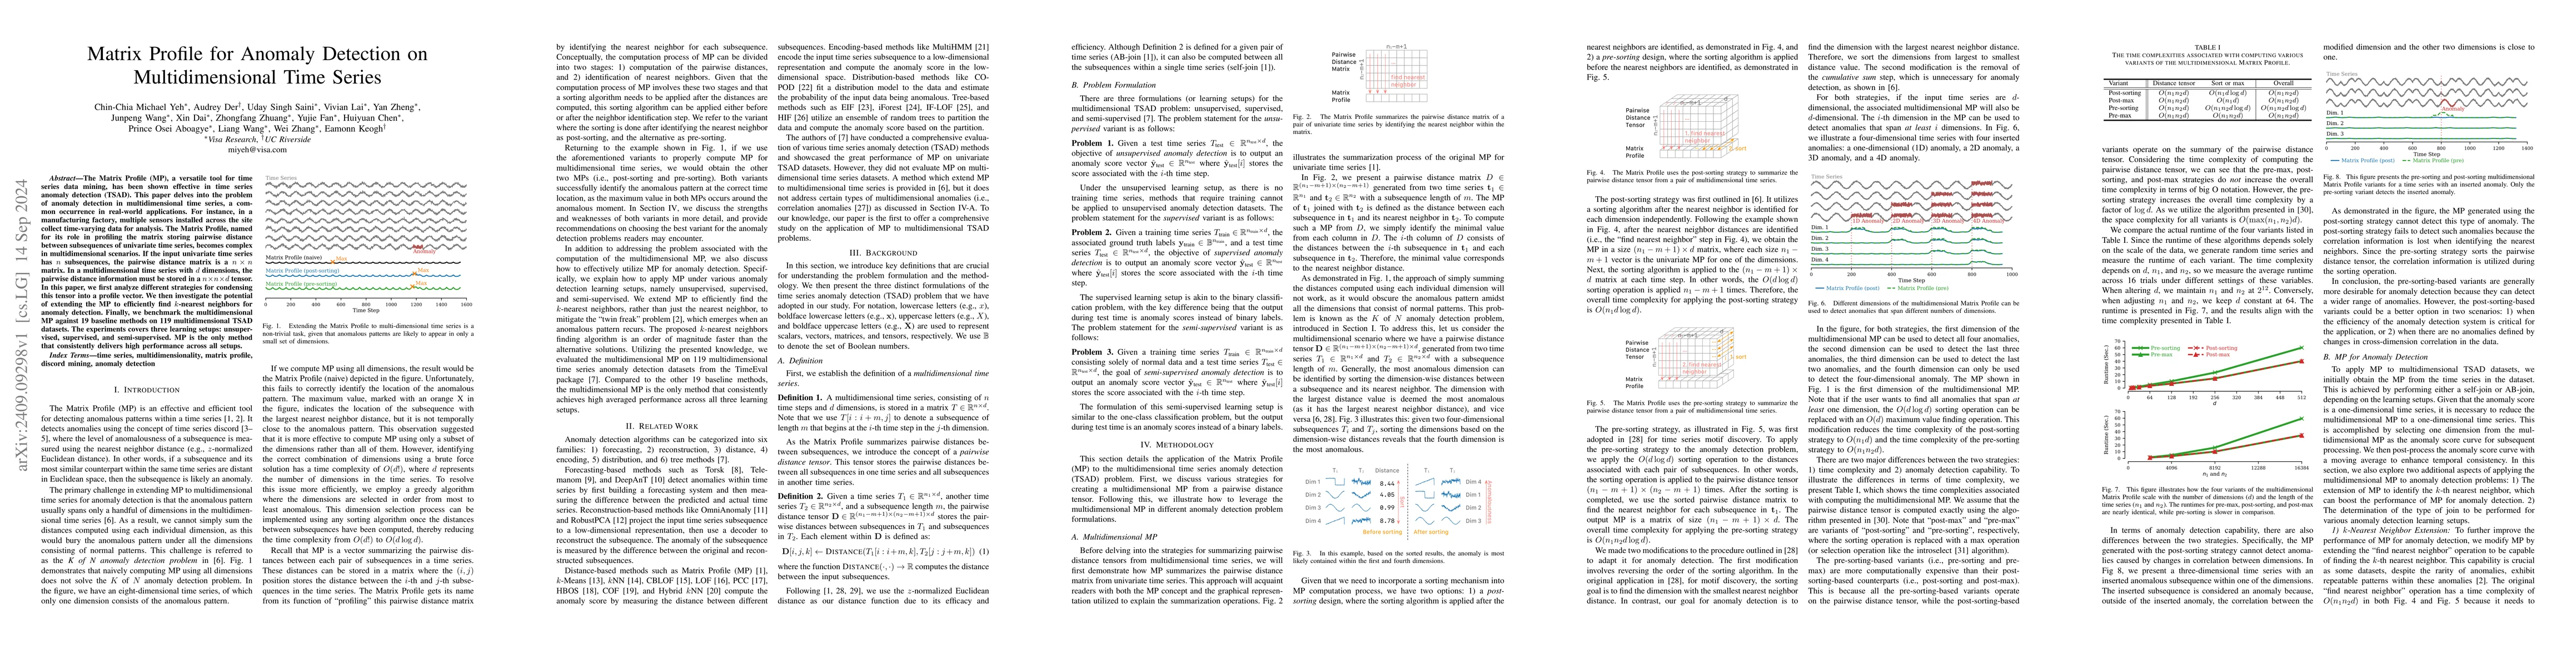
The Matrix Profile (MP), a versatile tool for time series data mining, has been shown effective in time series anomaly detection (TSAD). This paper delves into the problem of anomaly detection in multidimensional time series, a common occurrence in real-world applications. For instance, in a manufacturing factory, multiple sensors installed across the site collect time-varying data for analysis. The Matrix Profile, named for its role in profiling the matrix storing pairwise distance between subsequences of univariate time series, becomes complex in multidimensional scenarios. If the input univariate time series has n subsequences, the pairwise distance matrix is a n x n matrix. In a multidimensional time series with d dimensions, the pairwise distance information must be stored in a n x n x d tensor. In this paper, we first analyze different strategies for condensing this tensor into a profile vector. We then investigate the potential of extending the MP to efficiently find k-nearest neighbors for anomaly detection. Finally, we benchmark the multidimensional MP against 19 baseline methods on 119 multidimensional TSAD datasets. The experiments covers three learning setups: unsupervised, supervised, and semi-supervised. MP is the only method that consistently delivers high performance across all setups.
AI Key Findings
Get AI-generated insights about this paper's methodology, results, significance, and more — seven facets brought into focus.
Impact
Authors
PDF Preview
Citation Network
Current paper (gray), citations (green), references (blue)
Display is limited for performance on very large graphs.
Discussion 0