Maximum likelihood thresholds of Gaussian graphical models and graphical lasso
Publication
Metrics
AI Quick Summary
This paper investigates the maximum likelihood thresholds for Gaussian graphical models, focusing on the likelihood that graphical lasso can accurately select and fit the model when the number of data points is at least this threshold. The study employs computational experiments to explore this probability in high-dimensional settings.
Paper Preview
Abstract
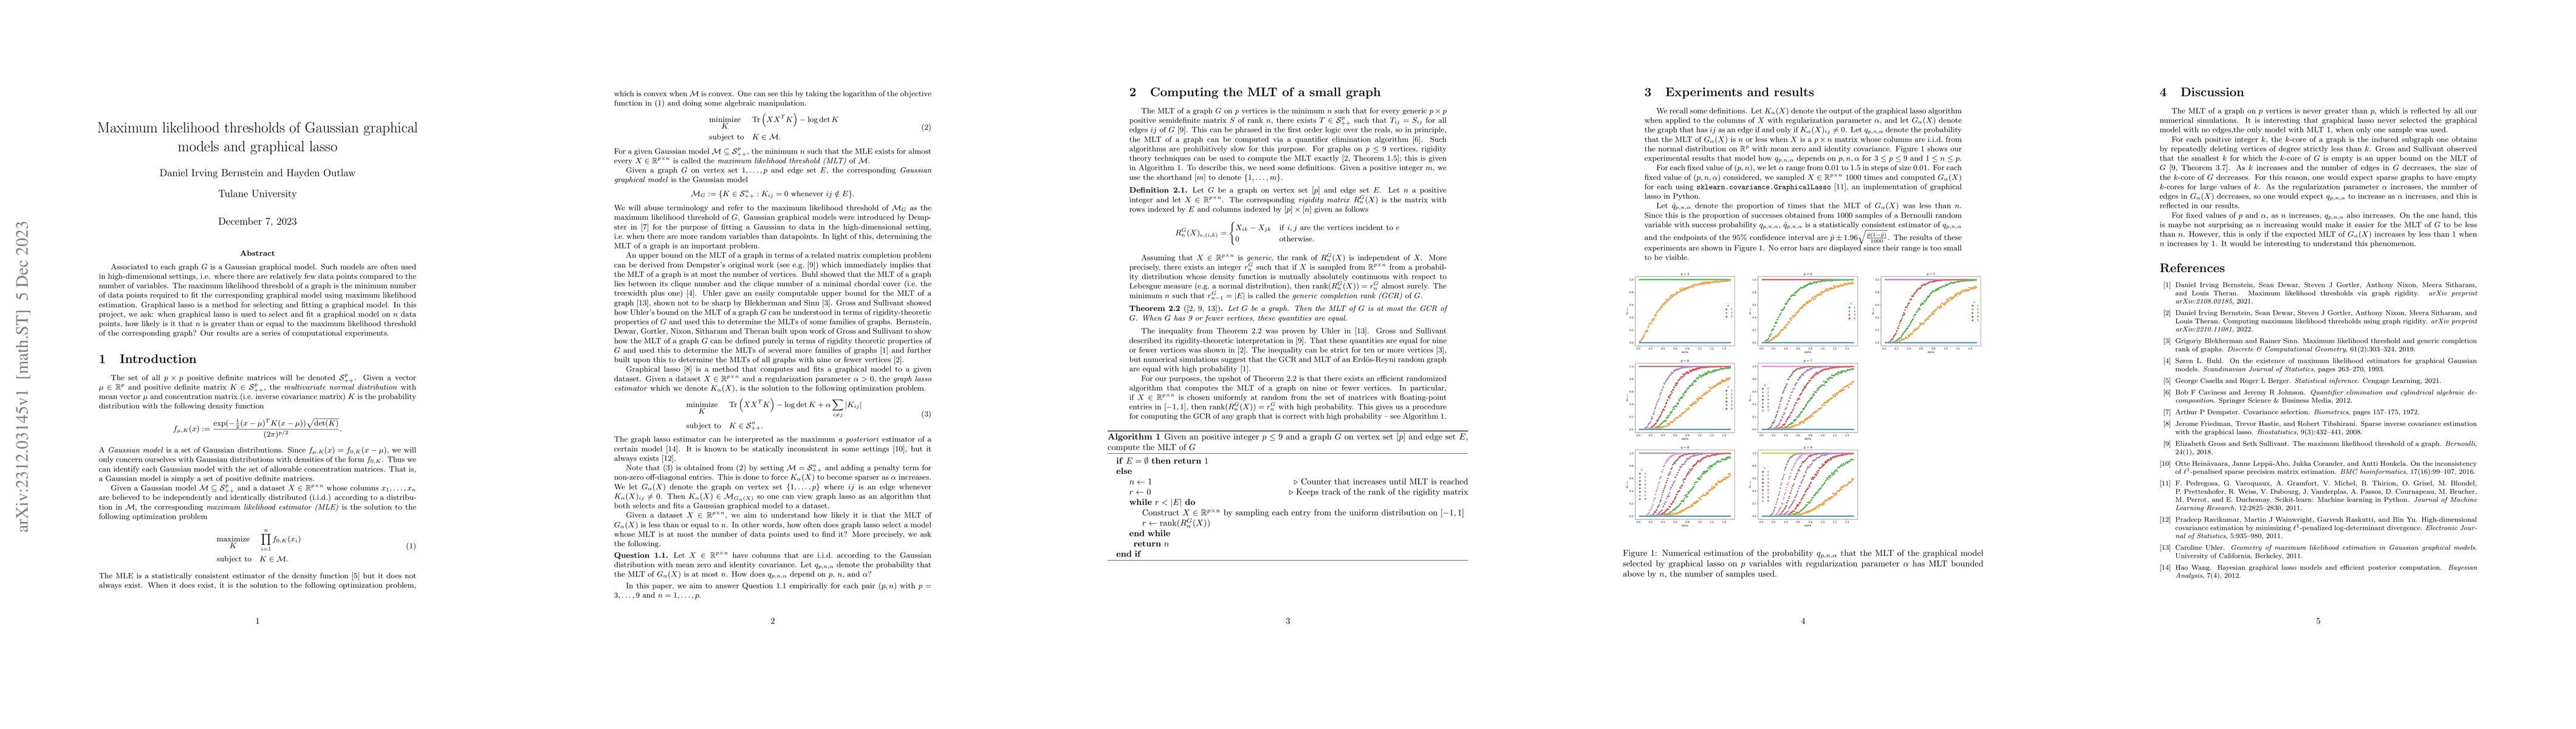
Associated to each graph G is a Gaussian graphical model. Such models are often used in high-dimensional settings, i.e. where there are relatively few data points compared to the number of variables. The maximum likelihood threshold of a graph is the minimum number of data points required to fit the corresponding graphical model using maximum likelihood estimation. Graphical lasso is a method for selecting and fitting a graphical model. In this project, we ask: when graphical lasso is used to select and fit a graphical model on n data points, how likely is it that n is greater than or equal to the maximum likelihood threshold of the corresponding graph? Our results are a series of computational experiments.
AI Key Findings
Get AI-generated insights about this paper's methodology, results, significance, and more — seven facets brought into focus.
Impact
Paper Details
Authors
PDF Preview
Key Terms
Citation Network
Current paper (gray), citations (green), references (blue)
Display is limited for performance on very large graphs.
Discussion 0