Summary
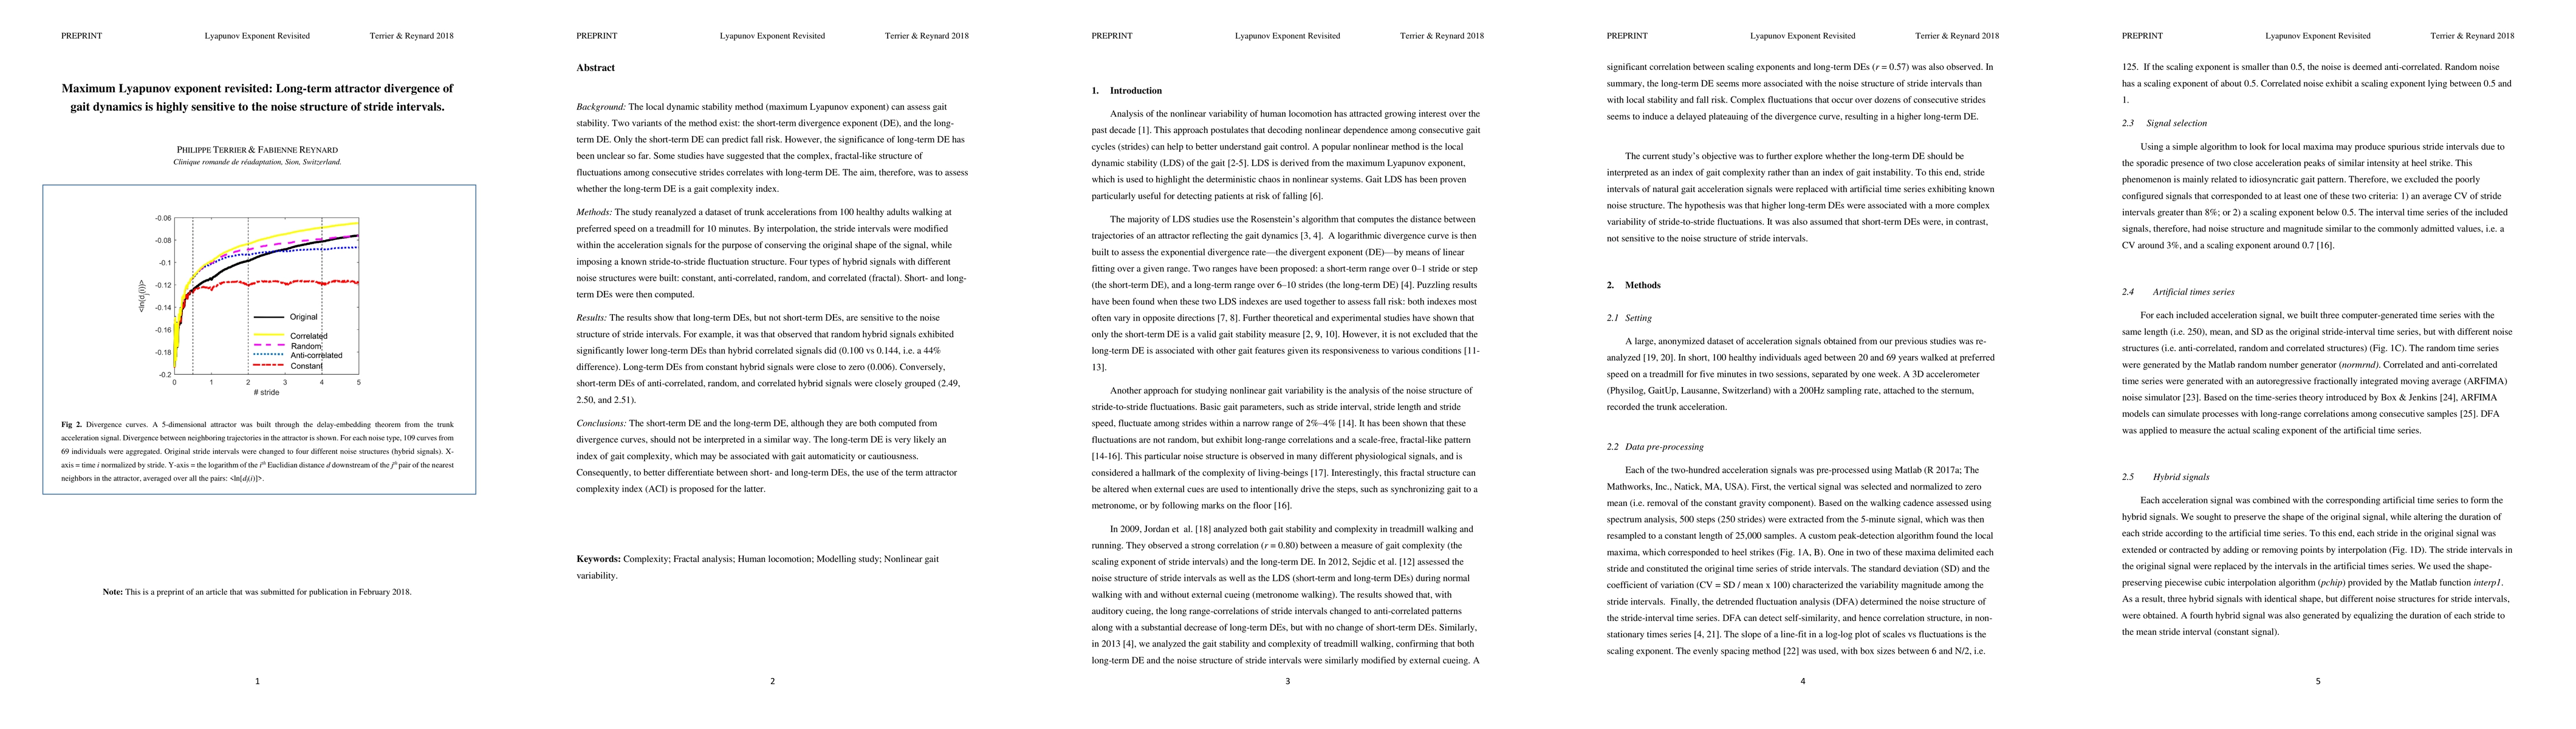
The local dynamic stability method (maximum Lyapunov exponent) can assess gait stability. Two variants of the method exist: the short-term divergence exponent (DE), and the long-term DE. Only the short-term DE can predict fall risk. The significance of long-term DE has been unclear so far. Some studies have suggested that the complex, fractal-like structure of fluctuations among consecutive strides correlates with long-term DE. The aim, therefore, was to assess whether the long-term DE is a gait complexity index. The study reanalyzed a dataset of trunk accelerations from 100 healthy adults walking at preferred speed on a treadmill for 10 minutes. By interpolation, the stride intervals were modified within the acceleration signals for the purpose of conserving the original shape of the signal, while imposing a known stride-to-stride fluctuation structure. 4 types of hybrid signals with different noise structures were built: constant, anti-correlated, random, and correlated (fractal). Short- and long-term DEs were then computed. The results show that long-term DEs, but not short-term DEs, are sensitive to the noise structure of stride intervals. It was that observed that random hybrid signals exhibited significantly lower long-term DEs than hybrid correlated signals did (0.100 vs 0.144, i.e. a 44% difference). Long-term DEs from constant hybrid signals were close to zero (0.006). Short-term DEs of anti-correlated, random, and correlated hybrid signals were closely grouped (2.49, 2.50, and 2.51). The short- and long-term DEs, although they are both computed from divergence curves, should not be interpreted in a similar way. The long-term DE is very likely an index of gait complexity, which may be associated with gait automaticity or cautiousness. To better differentiate between short- and long-term DEs, the use of the term attractor complexity index (ACI) is proposed for the latter.
AI Key Findings
Get AI-generated insights about this paper's methodology, results, and significance.
Paper Details
PDF Preview
Key Terms
Citation Network
Current paper (gray), citations (green), references (blue)
Display is limited for performance on very large graphs.
Similar Papers
Found 4 papers| Title | Authors | Year | Actions |
|---|
Comments (0)