Maybe, Maybe Not: A Survey on Uncertainty in Visualization
Publication
Metrics
AI Quick Summary
This paper surveys the importance of representing uncertainty in visualizations, detailing its impact across data collection, preprocessing, visualization, and inference stages. It reviews current methodologies for handling uncertainty and proposes future directions for research in this field.
Paper Preview
Abstract
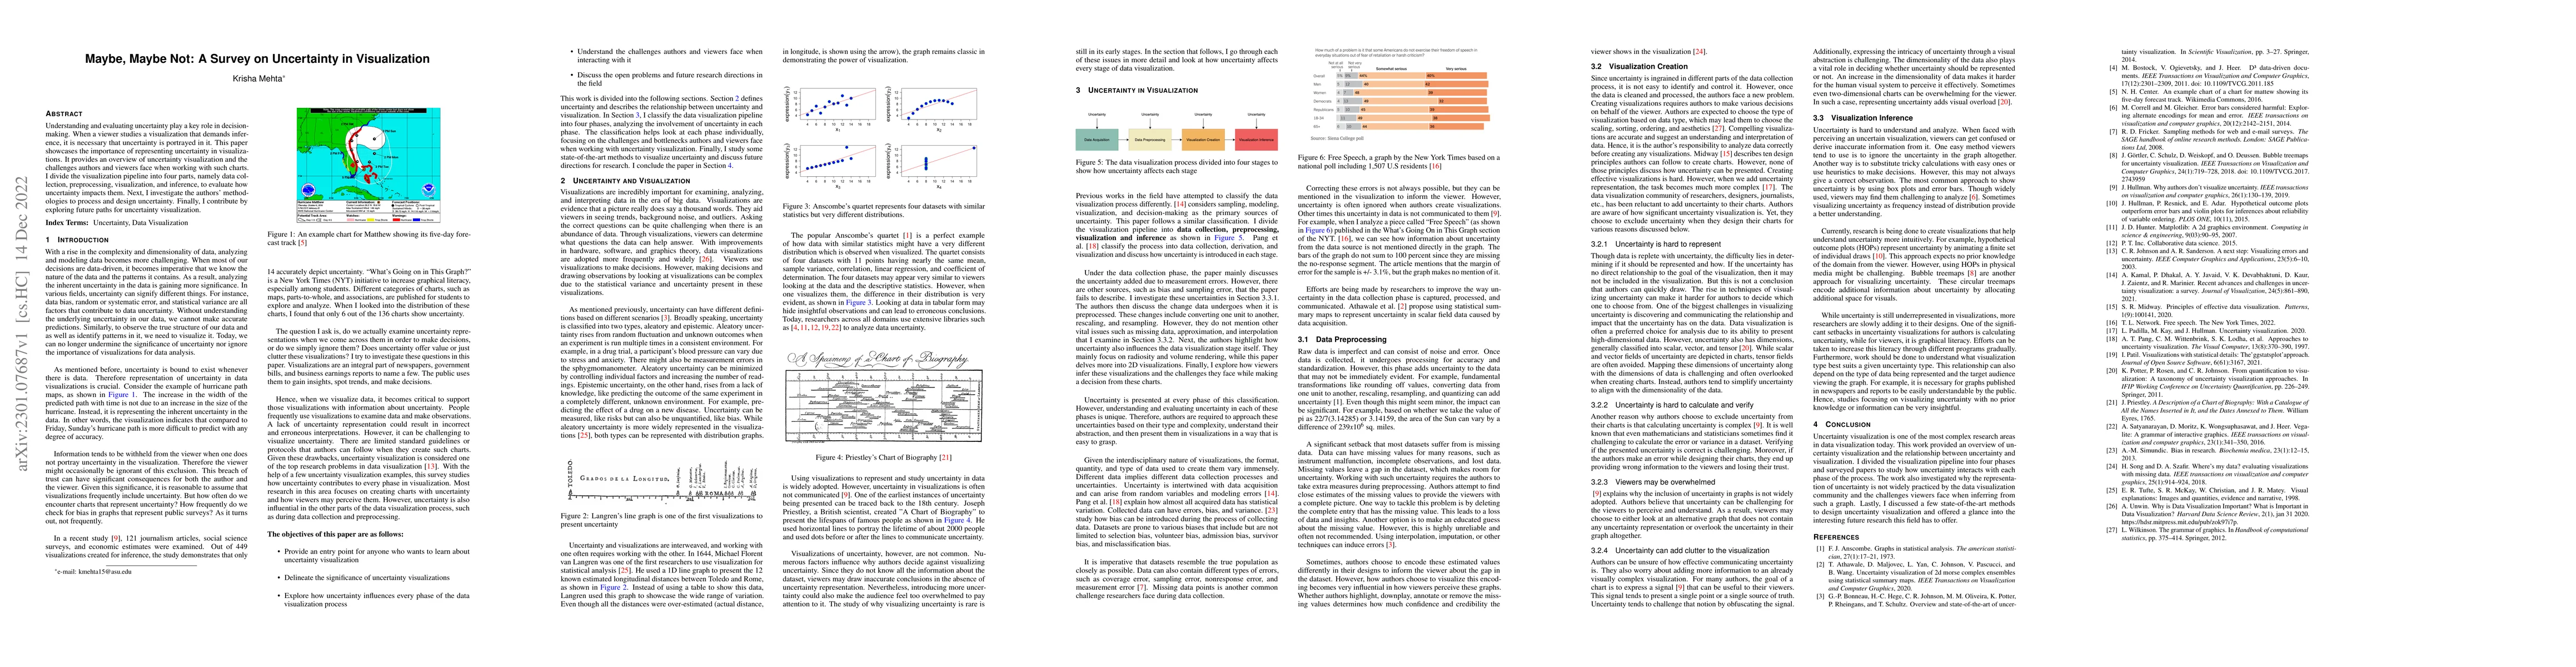
Understanding and evaluating uncertainty play a key role in decision-making. When a viewer studies a visualization that demands inference, it is necessary that uncertainty is portrayed in it. This paper showcases the importance of representing uncertainty in visualizations. It provides an overview of uncertainty visualization and the challenges authors and viewers face when working with such charts. I divide the visualization pipeline into four parts, namely data collection, preprocessing, visualization, and inference, to evaluate how uncertainty impacts them. Next, I investigate the authors' methodologies to process and design uncertainty. Finally, I contribute by exploring future paths for uncertainty visualization.
AI Key Findings
Get AI-generated insights about this paper's methodology, results, significance, and more — seven facets brought into focus.
Impact
Paper Details
Authors
PDF Preview
Key Terms
Citation Network
Current paper (gray), citations (green), references (blue)
Display is limited for performance on very large graphs.
Discussion 0