Summary
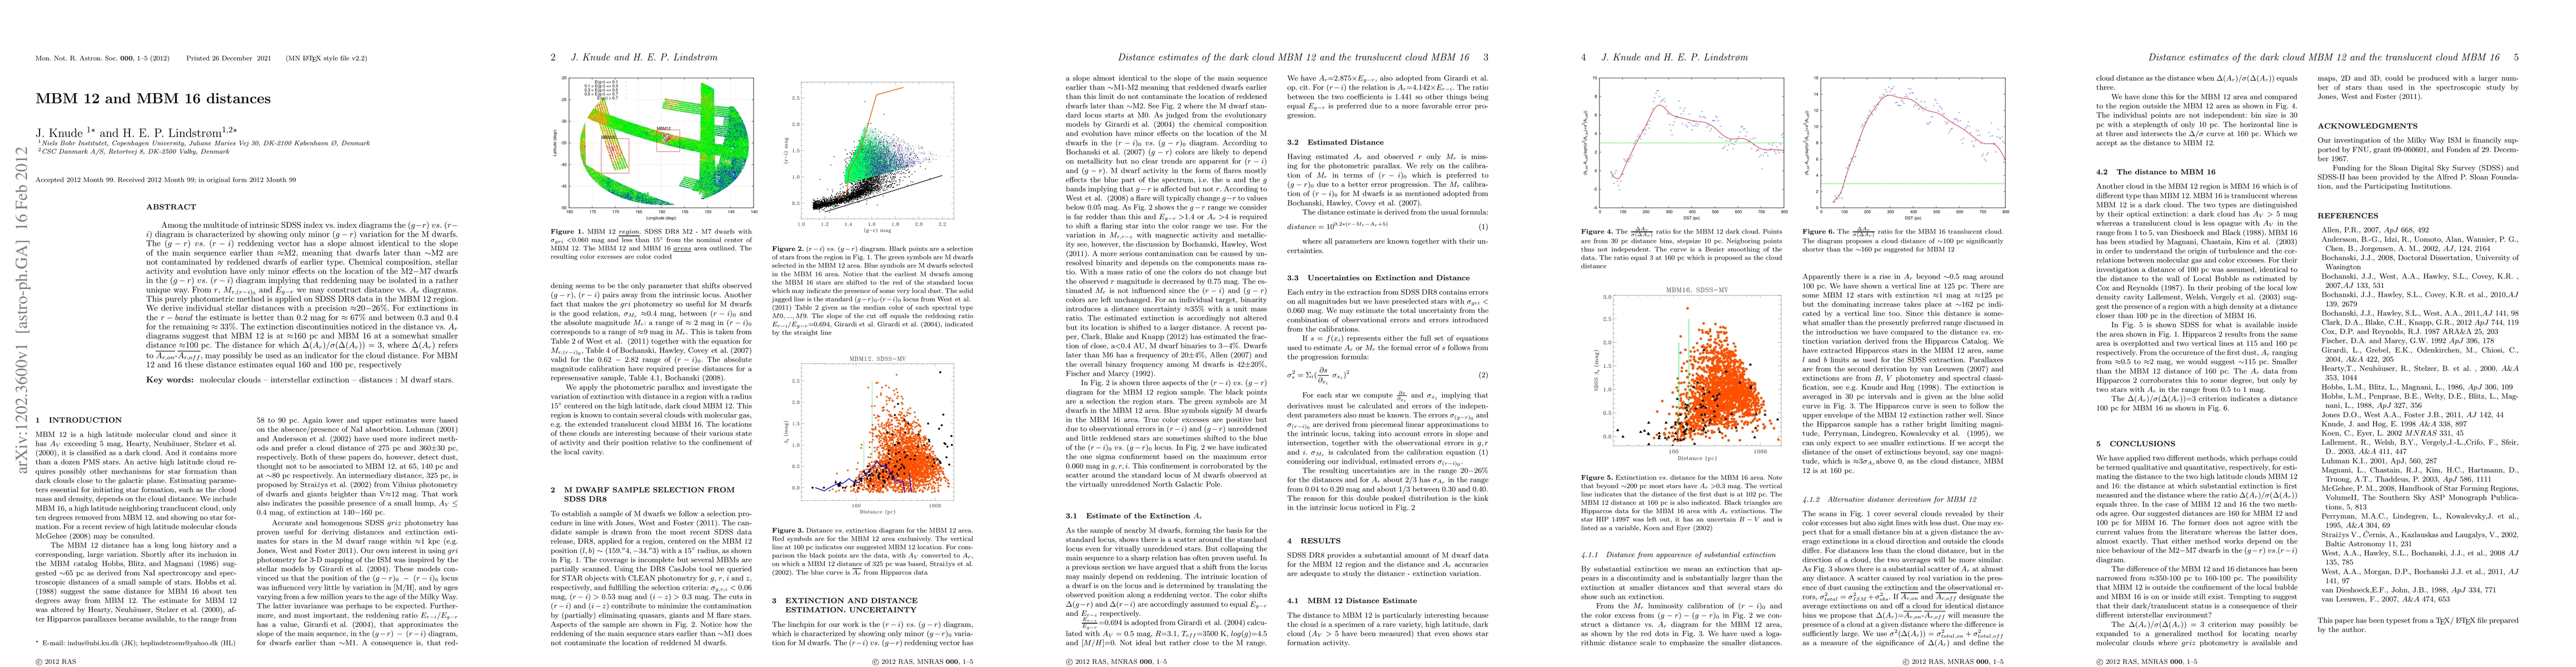
Among the multitude of intrinsic SDSS index vs. index diagrams the $(g-r) \ vs. \ (r-i)$ diagram is characterized by showing only minor $(g-r)$ variation for the M dwarfs. The $(g-r) \ vs. \ (r-i)$ reddening vector has a slope almost identical to the slope of the main sequence earlier than $\approx$M2, meaning that dwarfs later than $\sim$M2 are not contaminated by reddened dwarfs of earlier type. Chemical composition, stellar activity and evolution have only minor effects on the location of the M2$-$M7 dwarfs in the $(g-r) \ vs. \ (r-i)$ diagram implying that reddening may be isolated in a rather unique way. From $r$, $M_{r,(r-i)_0}$ and $E_{g-r}$ we may construct distance vs. $A_r$ diagrams. This purely photometric method is applied on SDSS DR8 data in the MBM 12 region. We derive individual stellar distances with a precision $\approx20-26$%. For extinctions in the $r-band$ the estimate is better than 0.2 mag for $\approx 67%$ and between 0.3 and 0.4 for the remaining $\approx 33%$. The extinction discontinuities noticed in the distance vs. $A_r$ diagrams suggest that MBM 12 is at $\approx$160 pc and MBM 16 at a somewhat smaller distance $\approx$100 pc. The distance for which $\Delta (A_r)/\sigma (\Delta(A_r))$ = 3, where $\Delta (A_r)$ refers to $\bar{A_{r, on}}-\bar{A_{r, off}}$, may possibly be used as an indicator for the cloud distance as well: For MBM 12 and 16 these distance estimates equal 160 and 100 pc, respectively
AI Key Findings - Failed
Key findings generation failed. Failed to start generation process
Paper Details
PDF Preview
Key Terms
Citation Network
Current paper (gray), citations (green), references (blue)
Display is limited for performance on very large graphs.
Similar Papers
Found 4 papersLoose threads: parsec-scale filamentation in the high Galactic latitude molecular clouds MBM 3 and MBM 16
Marco Monaci, Loris Magnani, Steven N. Shore
No citations found for this paper.
Comments (0)