01
MethodologyHow they did it
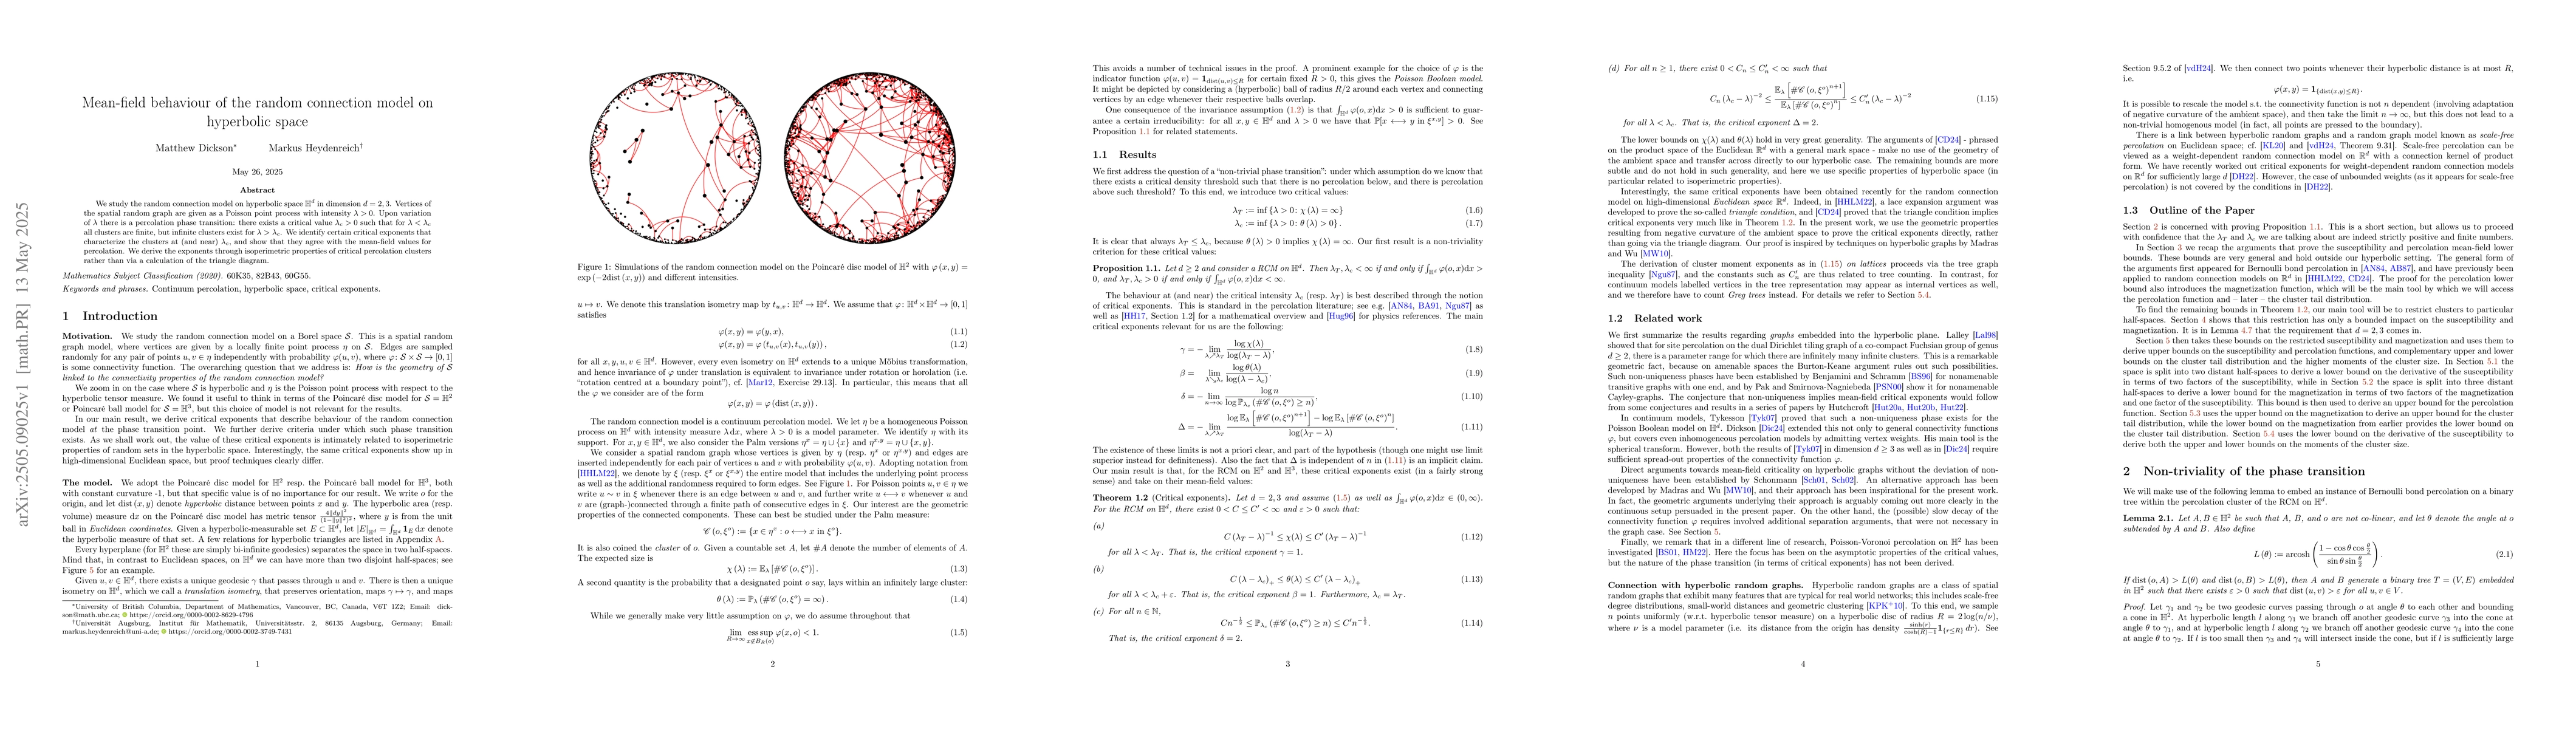
The research employs the random connection model on hyperbolic space $\mathbb{H}^d$ for dimensions $d=2,3$, using a Poisson point process with intensity $\lambda > 0$ as vertices of the spatial random graph. It identifies a percolation phase transition at a critical value $\lambda_c > 0$, characterizing clusters at and near $\lambda_c$ through isoperimetric properties rather than triangle diagram calculation.
Discussion 0