Summary
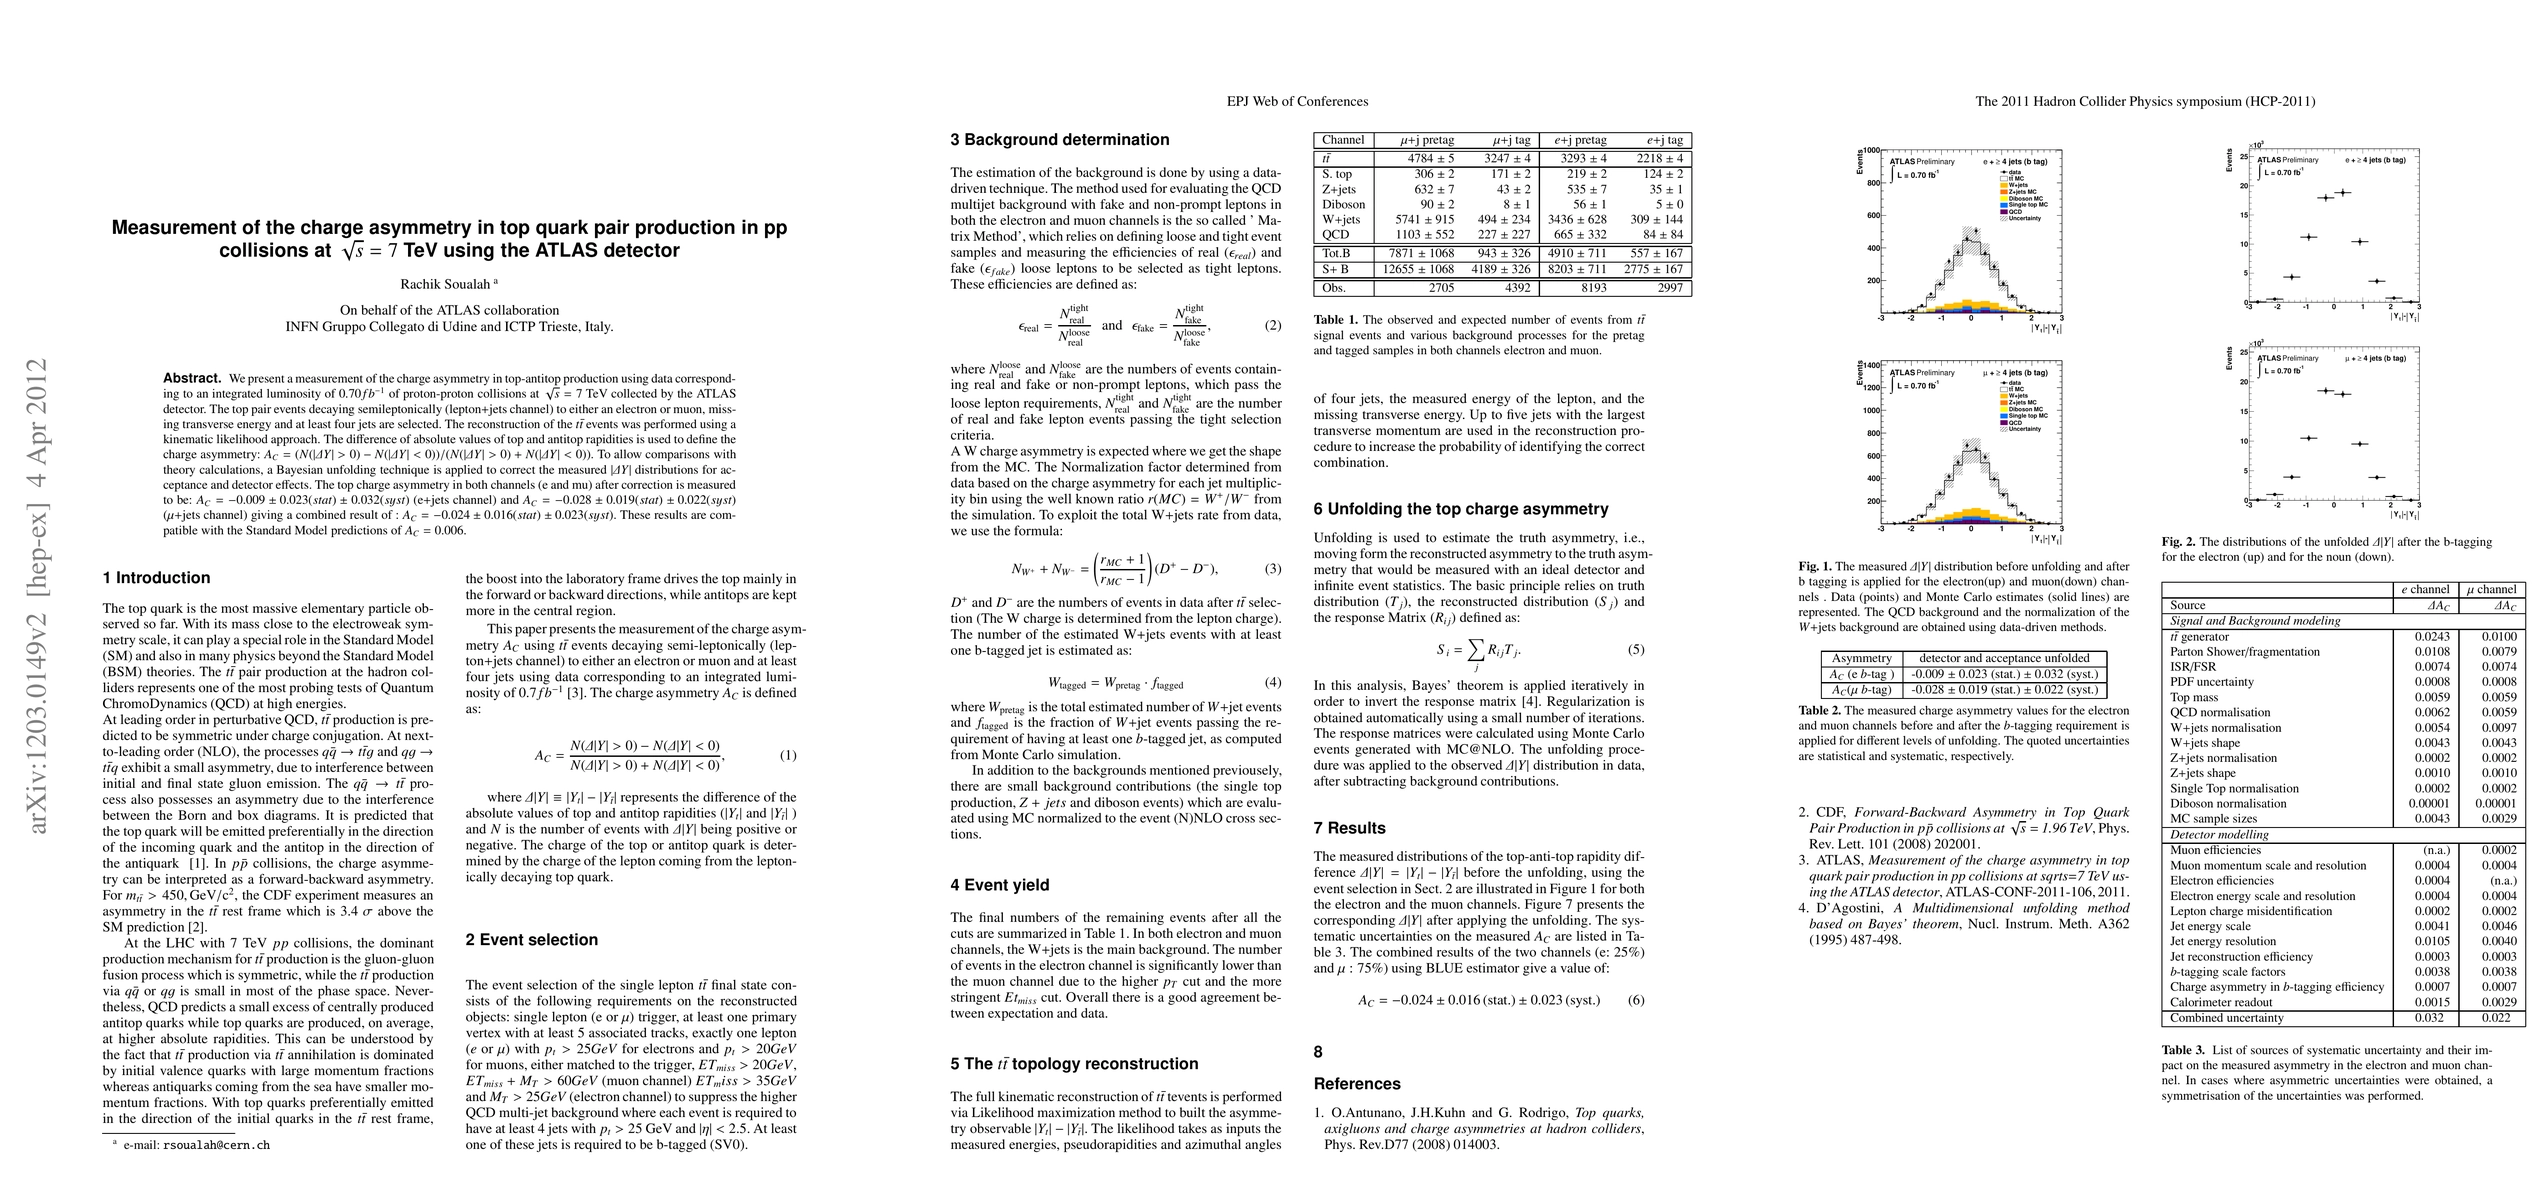
We present a measurement of the charge asymmetry in top-antitop production using data corresponding to an integrated luminosity of $0.70 fb^{-1}$ of proton-proton collisions at $\sqrt s = 7$ TeV collected by the ATLAS detector. The top pair events decaying semileptonically (lepton+jets channel) to either an electron or muon, missing transverse energy and at least four jets are selected. The reconstruction of the $t\bar{t}$ events was performed using a kinematic likelihood approach. The difference of absolute values of top and antitop rapidities is used to define the charge asymmetry: $A_{C} = (N(|\Delta Y|>0) - N(|\Delta Y|<0)) / (N(|\Delta Y>0) + N(|\Delta Y|<0))$. To allow comparisons with theory calculations, a Bayesian unfolding technique is applied to correct the measured $|\Delta Y|$ distributions for acceptance and detector effects. The top charge asymmetry in both channels (e and mu) after correction is measured to be: $A_{C} = -0.009 \pm 0.023 (stat) \pm 0.032 (syst)$ (e+jets channel) and $A_{C} = -0.028 \pm 0.019 (stat) \pm 0.022 (syst)$ ($\mu$+jets channel) giving a combined result of : $A_{C} = -0.024 \pm 0.016 (stat) \pm 0.023 (syst)$. These results are compatible with the Standard Model predictions of $A_{C}=0.006$.
AI Key Findings
Get AI-generated insights about this paper's methodology, results, and significance.
Paper Details
PDF Preview
Key Terms
Citation Network
Current paper (gray), citations (green), references (blue)
Display is limited for performance on very large graphs.
Similar Papers
Found 4 papersNo citations found for this paper.
Comments (0)