ArxivLens

Quick Summary:

This paper measures the cosmic muon charge ratio using CMS data, focusing on the ratio of positive to negative muons as a function of momentum. The study leverages the CMS experiment's muon barrel drift tube chambers and data collected during the Magnet Test and Cosmic Challenge, providing insights into atmospheric muon production and detector performance.

arXiv Id: 0810.3515
Comments: Poster at ICHEP08, Philadelphia, USA, July 2008. 4 pages
Date Published: 2008-10-21
Date Updated: 2008-10-21

Categories:

Key Terms (TF-IDF):

muon (0.296)
cosmic ray (0.258)
cosmic (0.252)
charge (0.206)
nuclei (0.178)
positive (0.175)
collected (0.174)
ray (0.173)
ratio (0.171)
detector (0.169)
physics (0.139)
test (0.136)
energy cosmic (0.132)
tube (0.130)
positive negative (0.130)
using data (0.128)
opportunity (0.125)
protons (0.125)
goals (0.124)
drift (0.120)
License: http://arxiv.org/licenses/nonexclusive-distrib/1.0/

Summary:

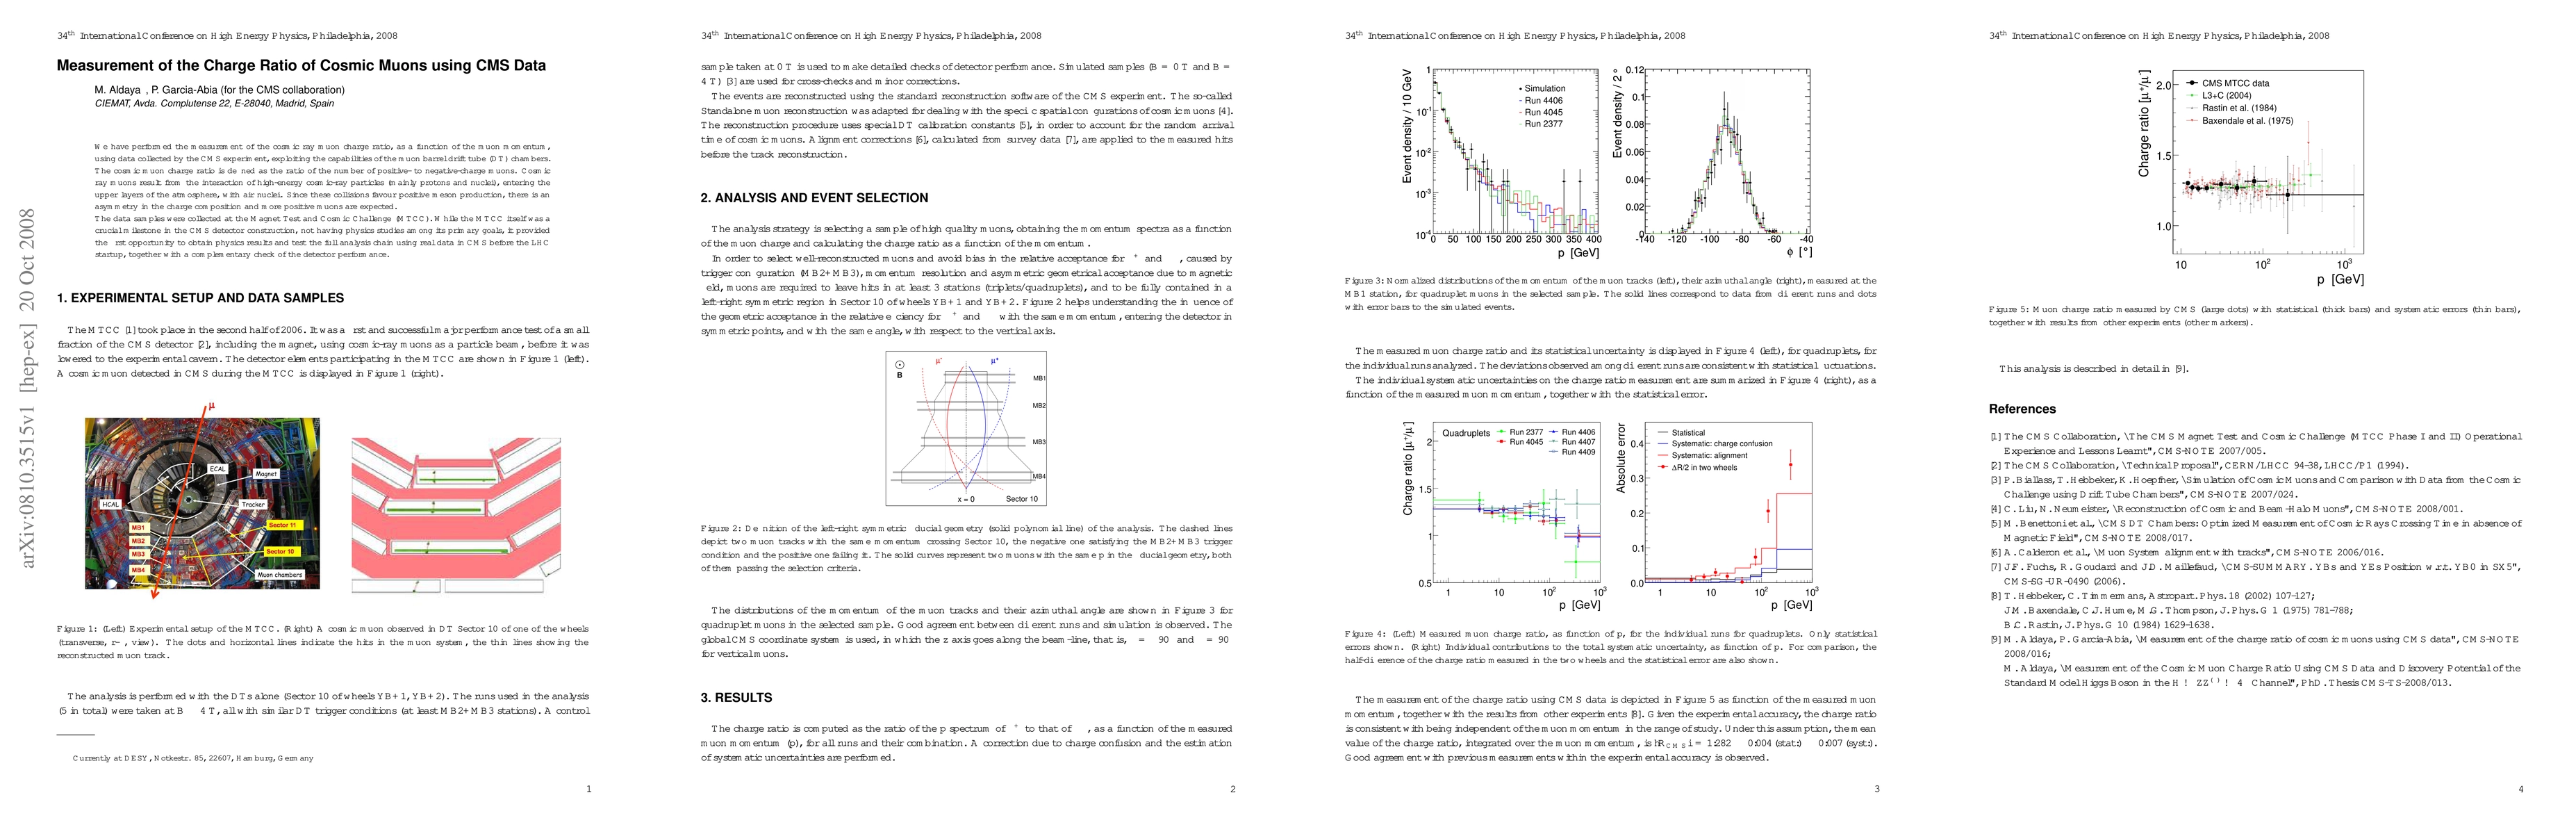
We have performed the measurement of the cosmic ray muon charge ratio, as a function of the muon momentum, using data collected by the CMS experiment, exploiting the capabilities of the muon barrel drift tube (DT) chambers. The cosmic muon charge ratio is defined as the ratio of the number of positive- to negative-charge muons. Cosmic ray muons result from the interaction of high-energy cosmic-ray particles (mainly protons and nuclei), entering the upper layers of the atmosphere, with air nuclei. Since these collisions favour positive meson production, there is an asymmetry in the charge composition and more positive muons are expected. The data samples were collected at the \textit{Magnet Test and Cosmic Challenge} (MTCC). While the MTCC itself was a crucial milestone in the CMS detector construction, not having physics studies among its primary goals, it provided the first opportunity to obtain physics results and test the full analysis chain using real data in CMS before the LHC startup, together with a complementary check of the detector performance.

Citation & Reference Network Visualization

This graph shows how this paper is connected to other research. The current paper is shown in dark gray, papers that cite it are in green, and papers it references are in blue. You can:

Current Paper
Papers citing this work (Citations)
Papers cited by this work (References)

• Hover over any node to see the paper title

• Click a node to view that paper's details

• Drag nodes to rearrange the graph

• Use the zoom controls (bottom right) to zoom in/out

Comments (0)

This website uses cookies to ensure you get the best experience. Learn more