Summary
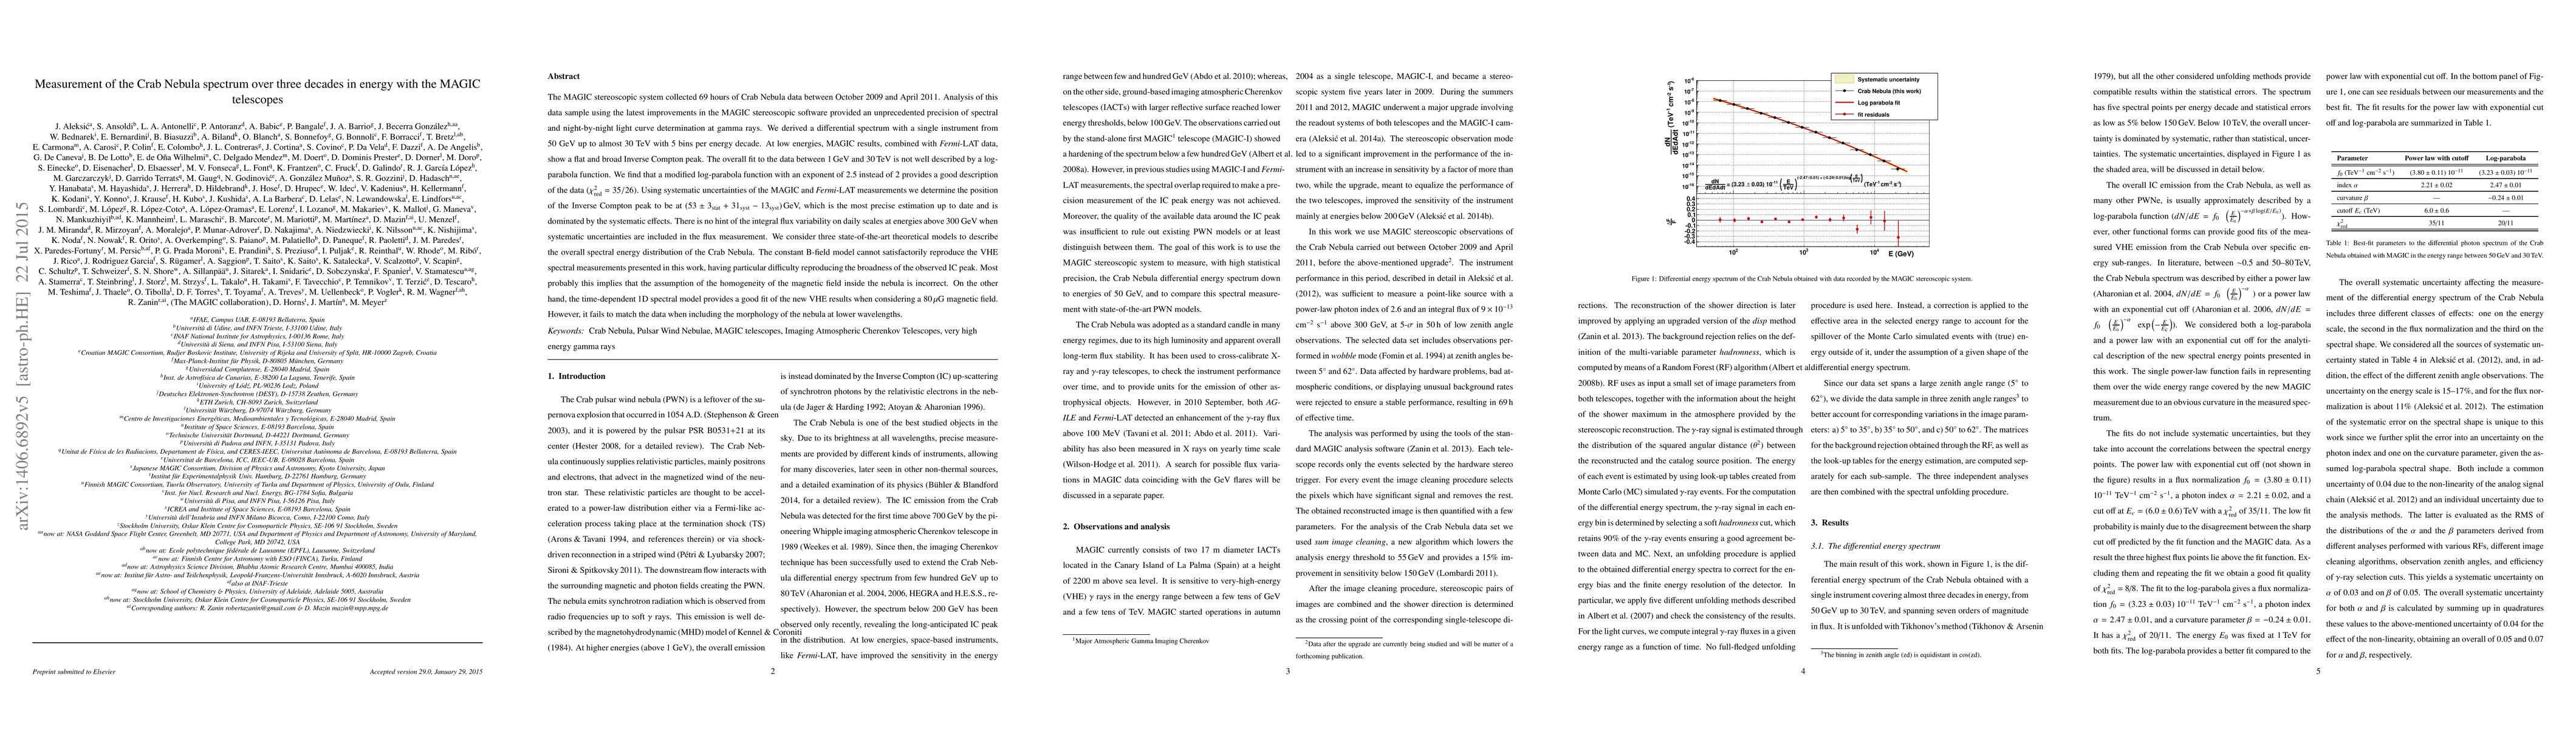
The MAGIC stereoscopic system collected 69 hours of Crab Nebula data between October 2009 and April 2011. Analysis of this data sample using the latest improvements in the MAGIC stereoscopic software provided an unprecedented precision of spectral and night-by-night light curve determination at gamma rays. We derived a differential spectrum with a single instrument from 50 GeV up to almost 30 TeV with 5 bins per energy decade. At low energies, MAGIC results, combined with Fermi-LAT data, show a flat and broad Inverse Compton peak. The overall fit to the data between 1 GeV and 30 TeV is not well described by a log-parabola function. We find that a modified log-parabola function with an exponent of 2.5 instead of 2 provides a good description of the data ($\chi^2=35/26$). Using systematic uncertainties of red the MAGIC and Fermi-LAT measurements we determine the position of the Inverse Compton peak to be at (53 $\pm$ 3stat + 31syst -13syst) GeV, which is the most precise estimation up to date and is dominated by the systematic effects. There is no hint of the integral flux variability on daily scales at energies above 300 GeV when systematic uncertainties are included in the flux measurement. We consider three state- of-the-art theoretical models to describe the overall spectral energy distribution of the Crab Nebula. The constant B-field model cannot satisfactorily reproduce the VHE spectral measurements presented in this work, having particular difficulty reproducing the broadness of the observed IC peak. Most probably this implies that the assumption of the homogeneity of the magnetic field inside the nebula is incorrect. On the other hand, the time-dependent 1D spectral model provides a good fit of the new VHE results when considering a 80 {\mu}G magnetic field. However, it fails to match the data when including the morphology of the nebula at lower wavelengths.
AI Key Findings
Get AI-generated insights about this paper's methodology, results, and significance.
Paper Details
PDF Preview
Key Terms
Citation Network
Current paper (gray), citations (green), references (blue)
Display is limited for performance on very large graphs.
| Title | Authors | Year | Actions |
|---|
Comments (0)