Authors
Summary
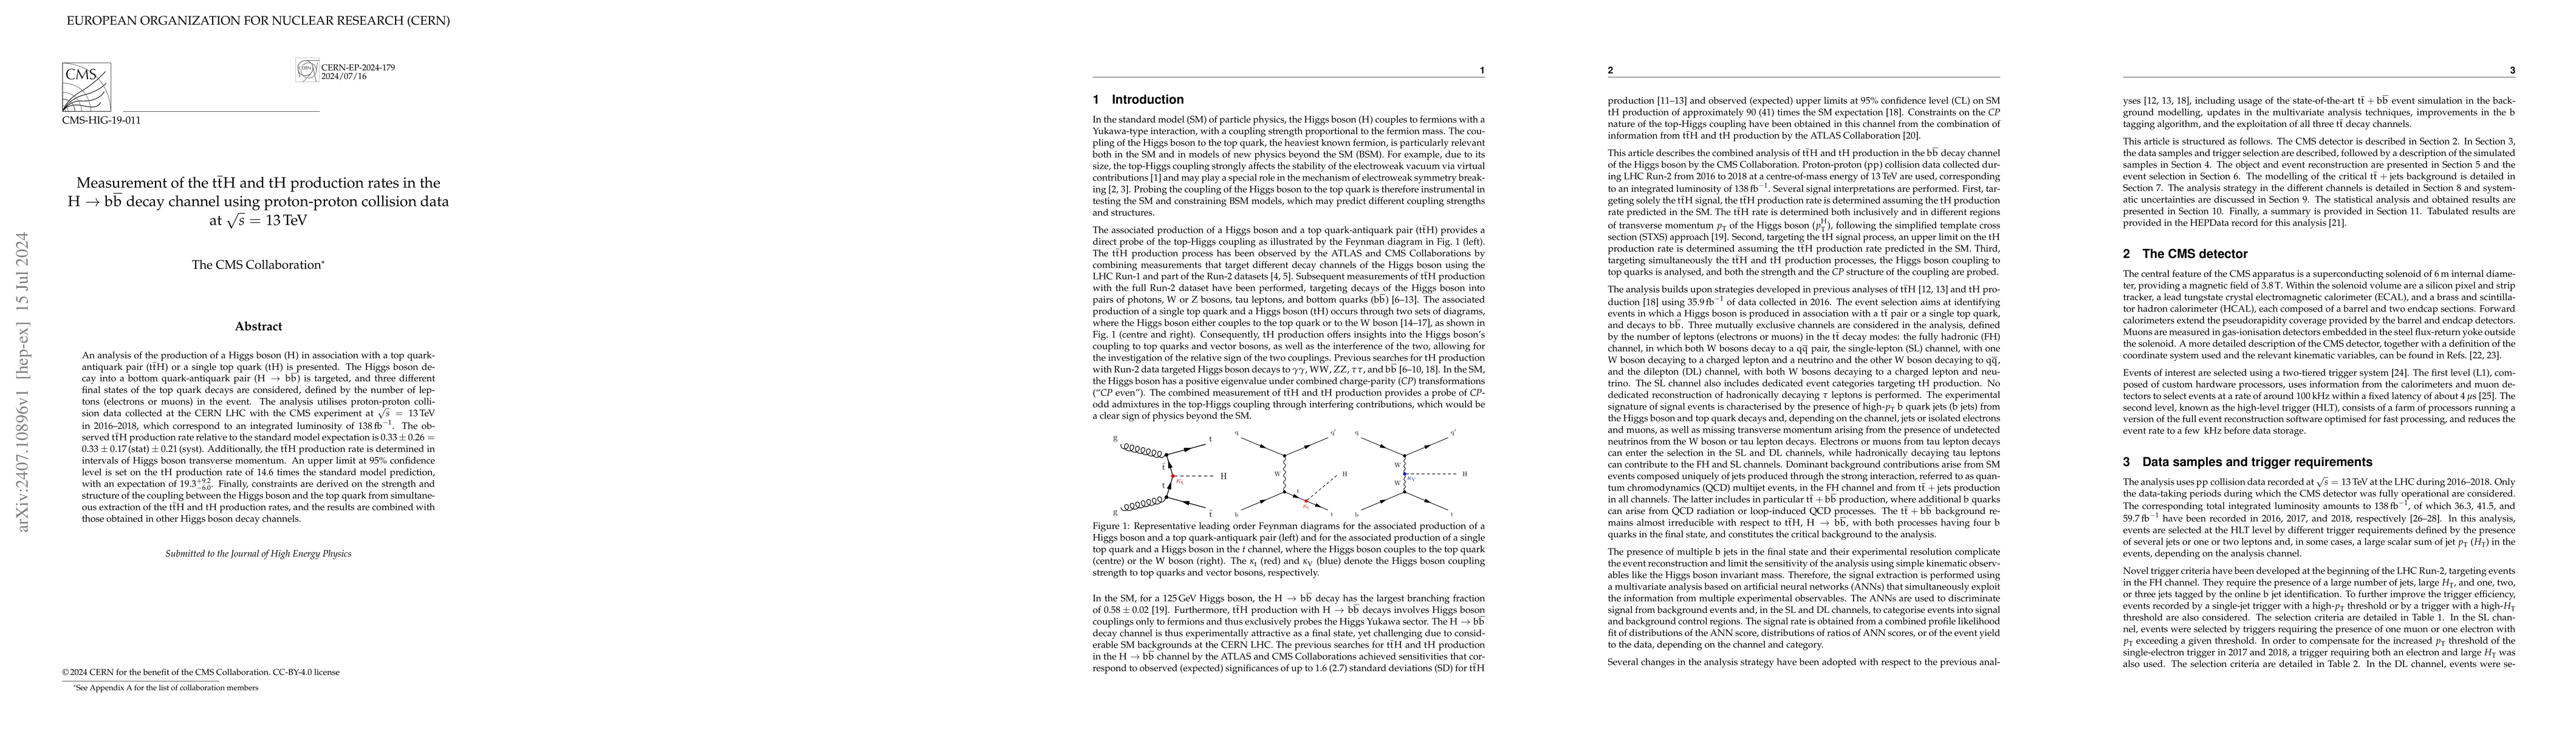
An analysis of the production of a Higgs boson (H) in association with a top quark-antiquark pair ($\mathrm{t\bar{t}}$H) or a single top quark (tH) is presented. The Higgs boson decay into a bottom quark-antiquark pair (H $\to$ $\mathrm{b\bar{b}}$) is targeted, and three different final states of the top quark decays are considered, defined by the number of leptons (electrons or muons) in the event. The analysis utilises proton-proton collision data collected at the CERN LHC with the CMS experiment at $\sqrt{s}$ = 13 TeV in 2016-2018, which correspond to an integrated luminosity of 138 fb$^{-1}$. The observed $\mathrm{t\bar{t}}$H production rate relative to the standard model expectation is 0.33 $\pm$ 0.26 = 0.33 $\pm$ 0.17 (stat) $\pm$ 0.21 (syst). Additionally, the $\mathrm{t\bar{t}}$H production rate is determined in intervals of Higgs boson transverse momentum. An upper limit at 95% confidence level is set on the tH production rate of 14.6 times the standard model prediction, with an expectation of 19.3$^{+9.2}_{-6.0}$. Finally, constraints are derived on the strength and structure of the coupling between the Higgs boson and the top quark from simultaneous extraction of the $\mathrm{t\bar{t}}$H and tH production rates, and the results are combined with those obtained in other Higgs boson decay channels.
AI Key Findings
Get AI-generated insights about this paper's methodology, results, and significance.
Paper Details
PDF Preview
Citation Network
Current paper (gray), citations (green), references (blue)
Display is limited for performance on very large graphs.
Similar Papers
Found 4 papersNo citations found for this paper.
Comments (0)