Summary
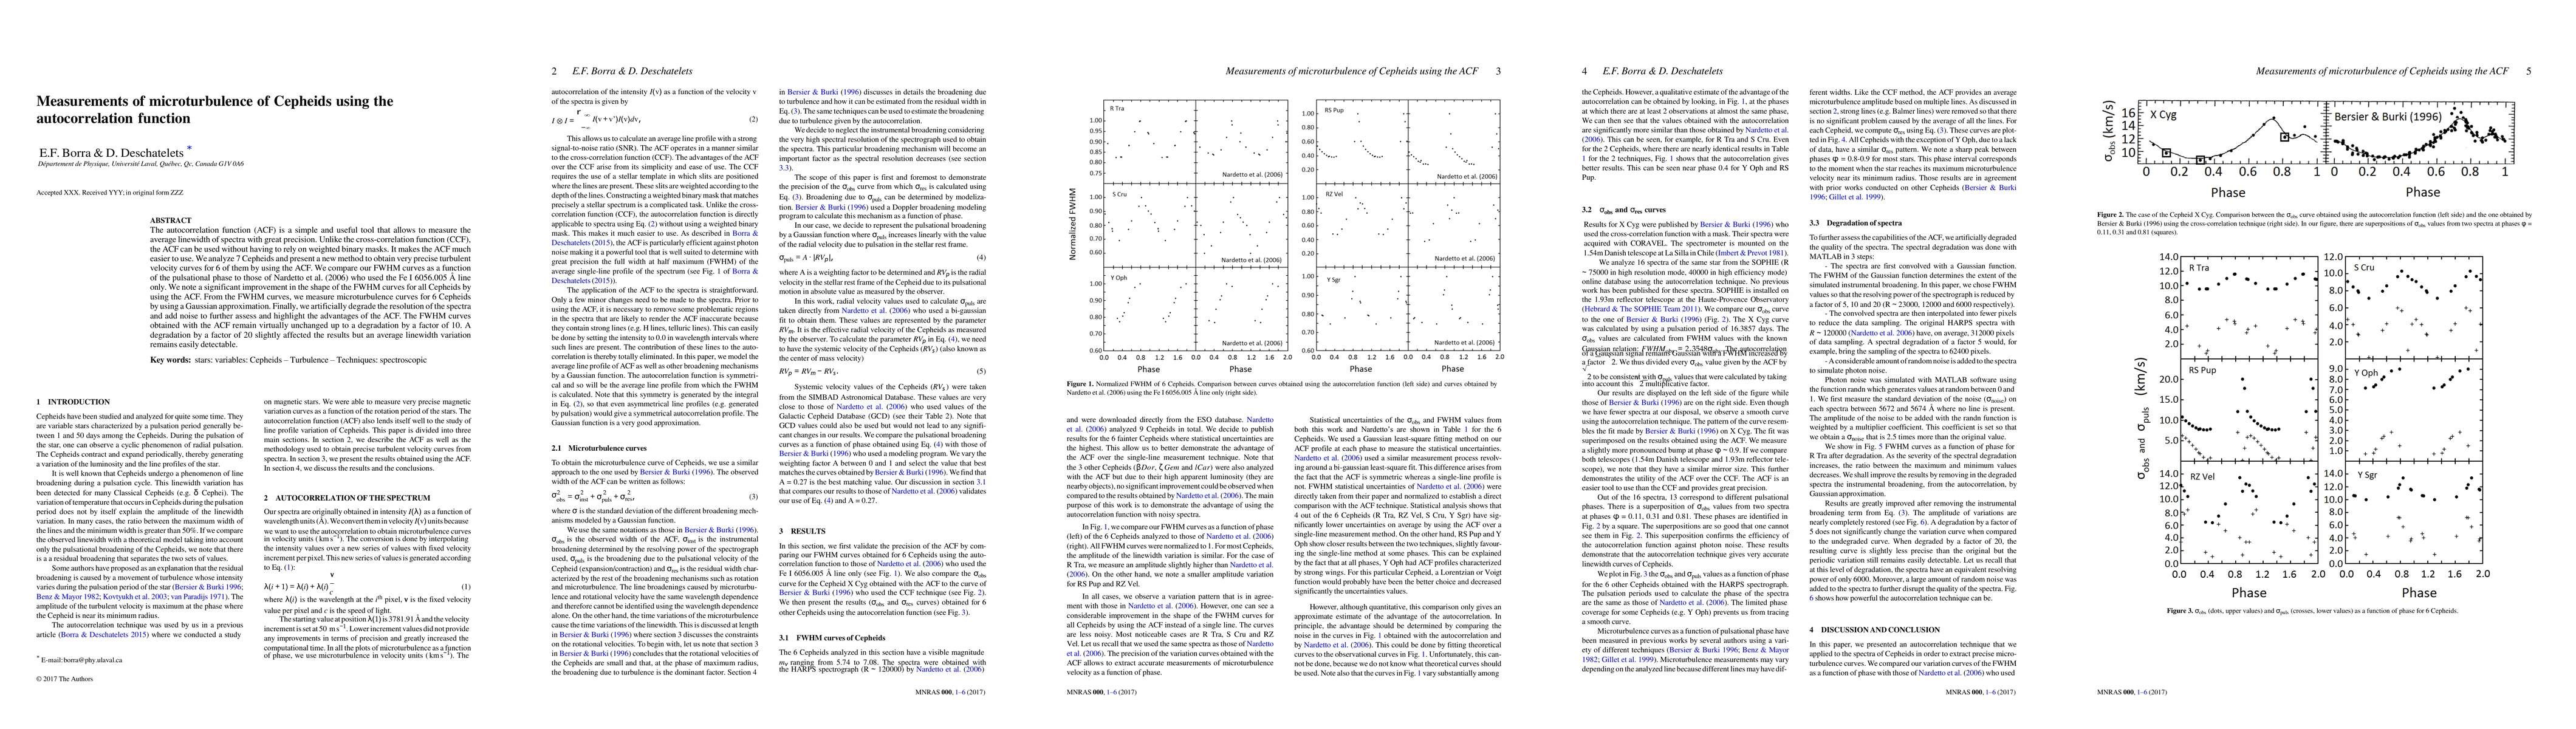
The autocorrelation function (ACF) is a simple and useful tool that allows to measure the average linewidth of spectra with great precision. Unlike the cross-correlation function (CCF), the ACF can be used without having to rely on weighted binary masks. It makes the ACF much easier to use. We analyze 7 Cepheids and present a new method to obtain very precise turbulent velocity curves for 6 of them by using the ACF. We compare our Full Widths at Half-Maximum (FWHM) curves as a function of the pulsational phase to those of Nardetto et al. (2006) who used the Fe I 6056.005 {\AA} line only. We note a significant improvement in the shape of the FWHM curves for all Cepheids by using the ACF. From the FWHM curves, we measure microturbulence curves for 6 Cepheids by using a Gaussian approximation. Finally, we artificially degrade the resolution of the spectra and add noise to further assess and highlight the advantages of the ACF. The FWHM curves obtained with the ACF remain virtually unchanged up to a degradation by a factor of 10. A degradation by a factor of 20 slightly affected the results but an average linewidth variation remains easily detectable.
AI Key Findings
Get AI-generated insights about this paper's methodology, results, and significance.
Paper Details
PDF Preview
Key Terms
Citation Network
Current paper (gray), citations (green), references (blue)
Display is limited for performance on very large graphs.
Similar Papers
Found 4 papers| Title | Authors | Year | Actions |
|---|
Comments (0)