Summary
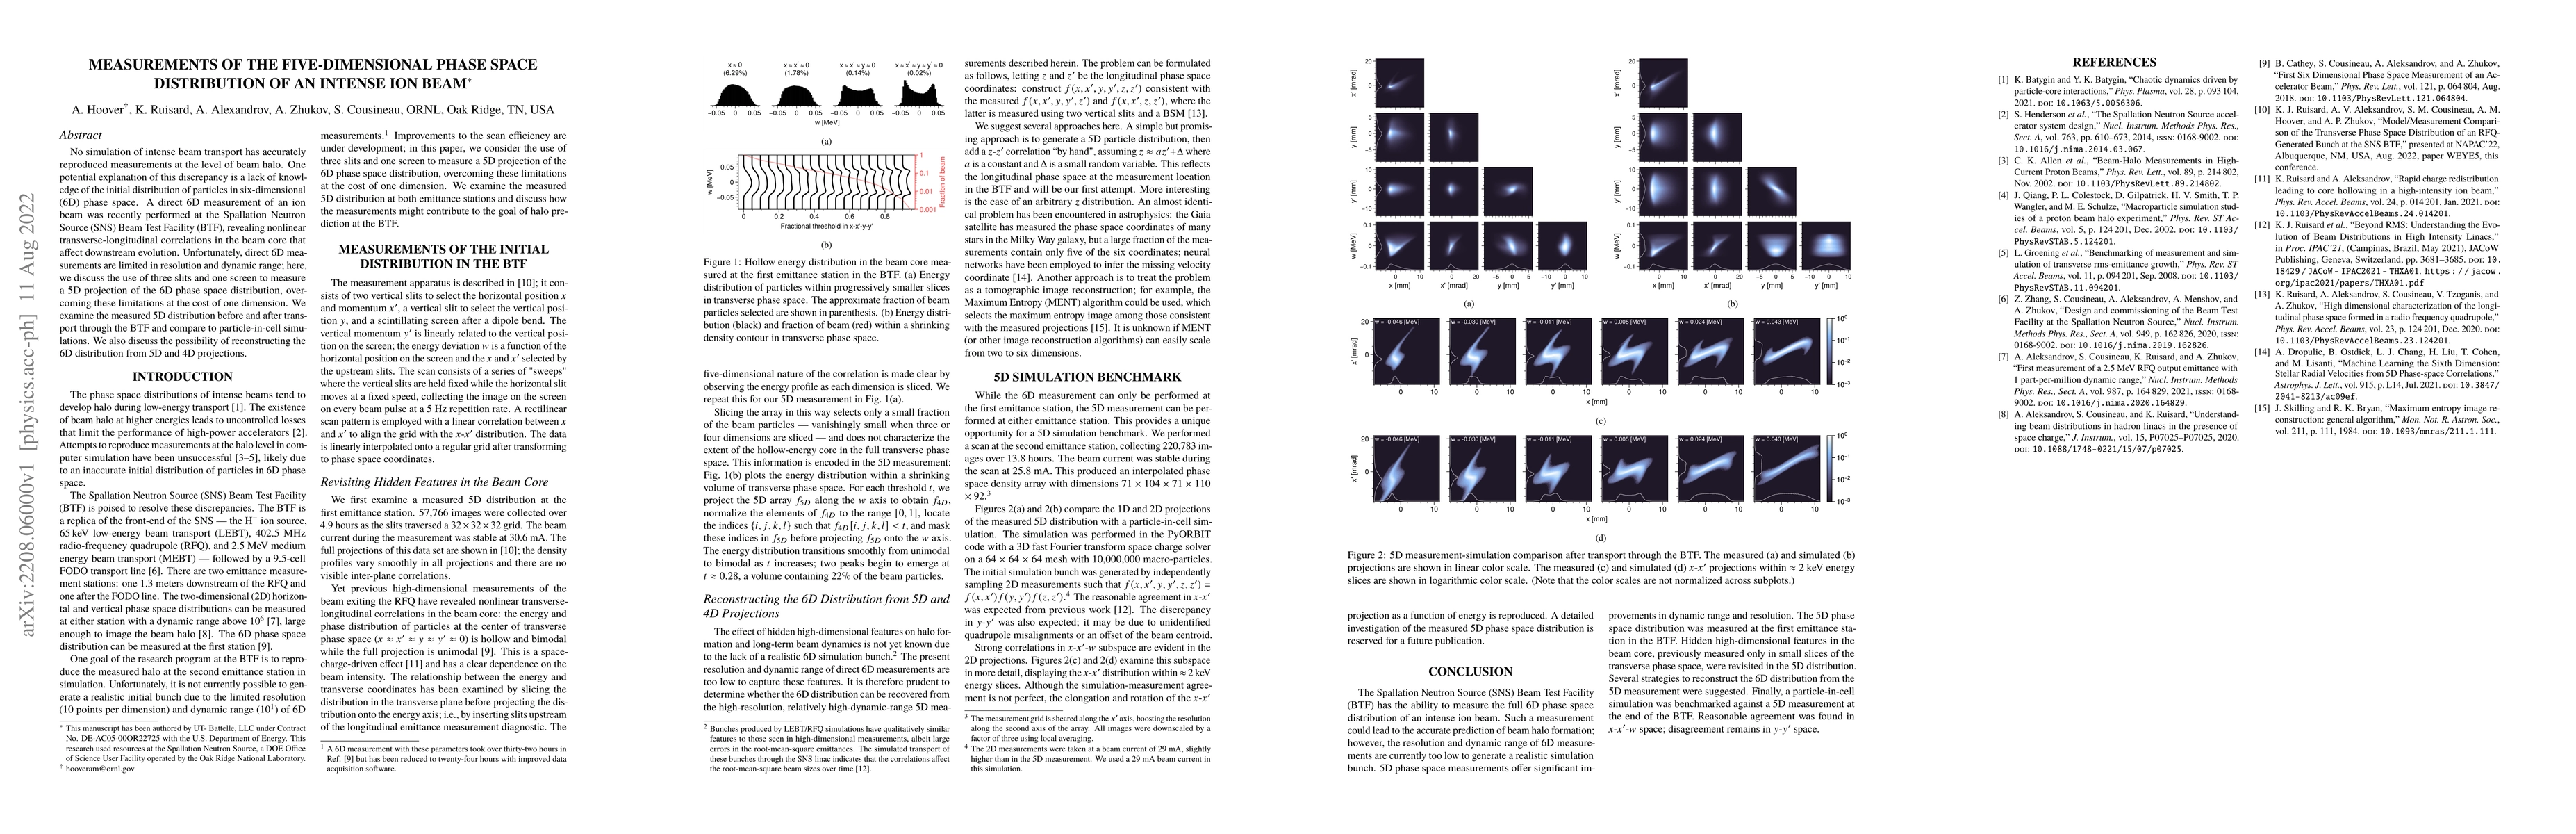
No simulation of intense beam transport has accurately reproduced measurements at the level of beam halo. One potential explanation of this discrepancy is a lack of knowledge of the initial distribution of particles in six-dimensional (6D)~phase space. A direct 6D measurement of an ion beam was recently performed at the Spallation Neutron Source (SNS) Beam Test Facility (BTF), revealing nonlinear transverse-longitudinal correlations in the beam core that affect downstream evolution. Unfortunately, direct 6D~measurements are limited in resolution and dynamic range; here, we discuss the use of three slits and one screen to measure a 5D projection of the 6D phase space distribution, overcoming these limitations at the cost of one dimension. We examine the measured 5D distribution before and after transport through the BTF and compare to particle-in-cell simulations. We also discuss the possibility of reconstructing the 6D distribution from 5D and 4D projections.
AI Key Findings
Get AI-generated insights about this paper's methodology, results, and significance.
Paper Details
PDF Preview
Key Terms
Citation Network
Current paper (gray), citations (green), references (blue)
Display is limited for performance on very large graphs.
Similar Papers
Found 4 papersAnalysis of a hadron beam in five-dimensional phase space
Austin Hoover, Alexander Zhukov, Kiersten Ruisard et al.
No citations found for this paper.
Comments (0)