01
MethodologyHow they did it
The research administered a composite test of five widely used data visualization literacy tests to 503 U.S. adults.
A study measured the difficulty of data visualization tasks in a large sample of US adults, finding that item-level difficulty was highly reliable but task-specific factors only explained a small amount of variation in performance.
A study measured the difficulty of data visualization tasks in a large sample of US adults, finding that item-level difficulty was highly reliable but task-specific factors only explained a small amount of variation in performance.
The research administered a composite test of five widely used data visualization literacy tests to 503 U.S. adults. More in Methodology →
Items in the composite test showed a full range of difficulty levels with reliable estimates. — Type of data visualization and task type explained only a modest amount of performance variation. More in Key Results →
This research highlights the need for finer-grained characterization of data visualization tasks to predict reliable difficulty variations and generalize to other tests. More in Significance →
The study was limited to U.S. adults, so findings may not generalize to other populations. — Reliance on existing tests for the composite test might limit novel insights. More in Limitations →
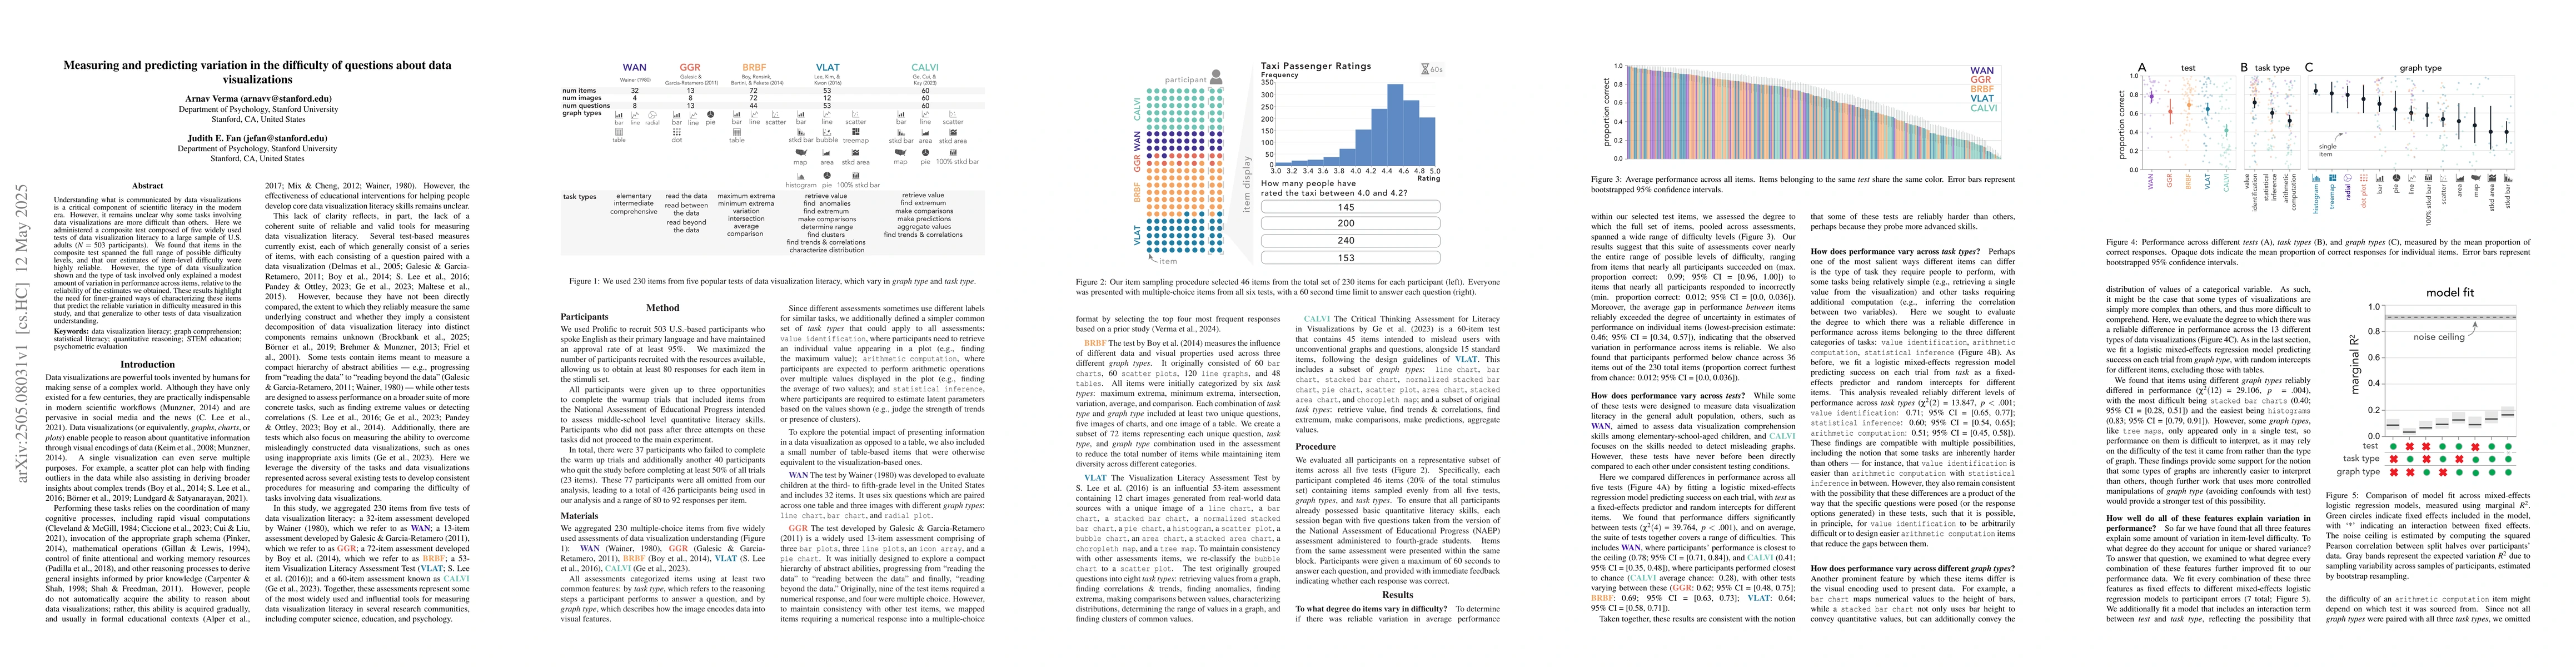
Understanding what is communicated by data visualizations is a critical component of scientific literacy in the modern era. However, it remains unclear why some tasks involving data visualizations are more difficult than others. Here we administered a composite test composed of five widely used tests of data visualization literacy to a large sample of U.S. adults (N=503 participants).We found that items in the composite test spanned the full range of possible difficulty levels, and that our estimates of item-level difficulty were highly reliable. However, the type of data visualization shown and the type of task involved only explained a modest amount of variation in performance across items, relative to the reliability of the estimates we obtained. These results highlight the need for finer-grained ways of characterizing these items that predict the reliable variation in difficulty measured in this study, and that generalize to other tests of data visualization understanding.
Seven facets of this paper, analysed and brought into focus by AI.
This research highlights the need for finer-grained characterization of data visualization tasks to predict reliable difficulty variations and generalize to other tests.
The research administered a composite test of five widely used data visualization literacy tests to 503 U.S. adults.
This research highlights the need for finer-grained characterization of data visualization tasks to predict reliable difficulty variations and generalize to other tests.
Introduced a method to measure and predict variation in difficulty of data visualization tasks.
Unlike previous work, this research emphasizes the modest explanatory power of visualization type and task type on difficulty, calling for more nuanced approaches.
Current paper (gray), citations (green), references (blue)
Display is limited for performance on very large graphs.
Discussion 0