Authors
Summary
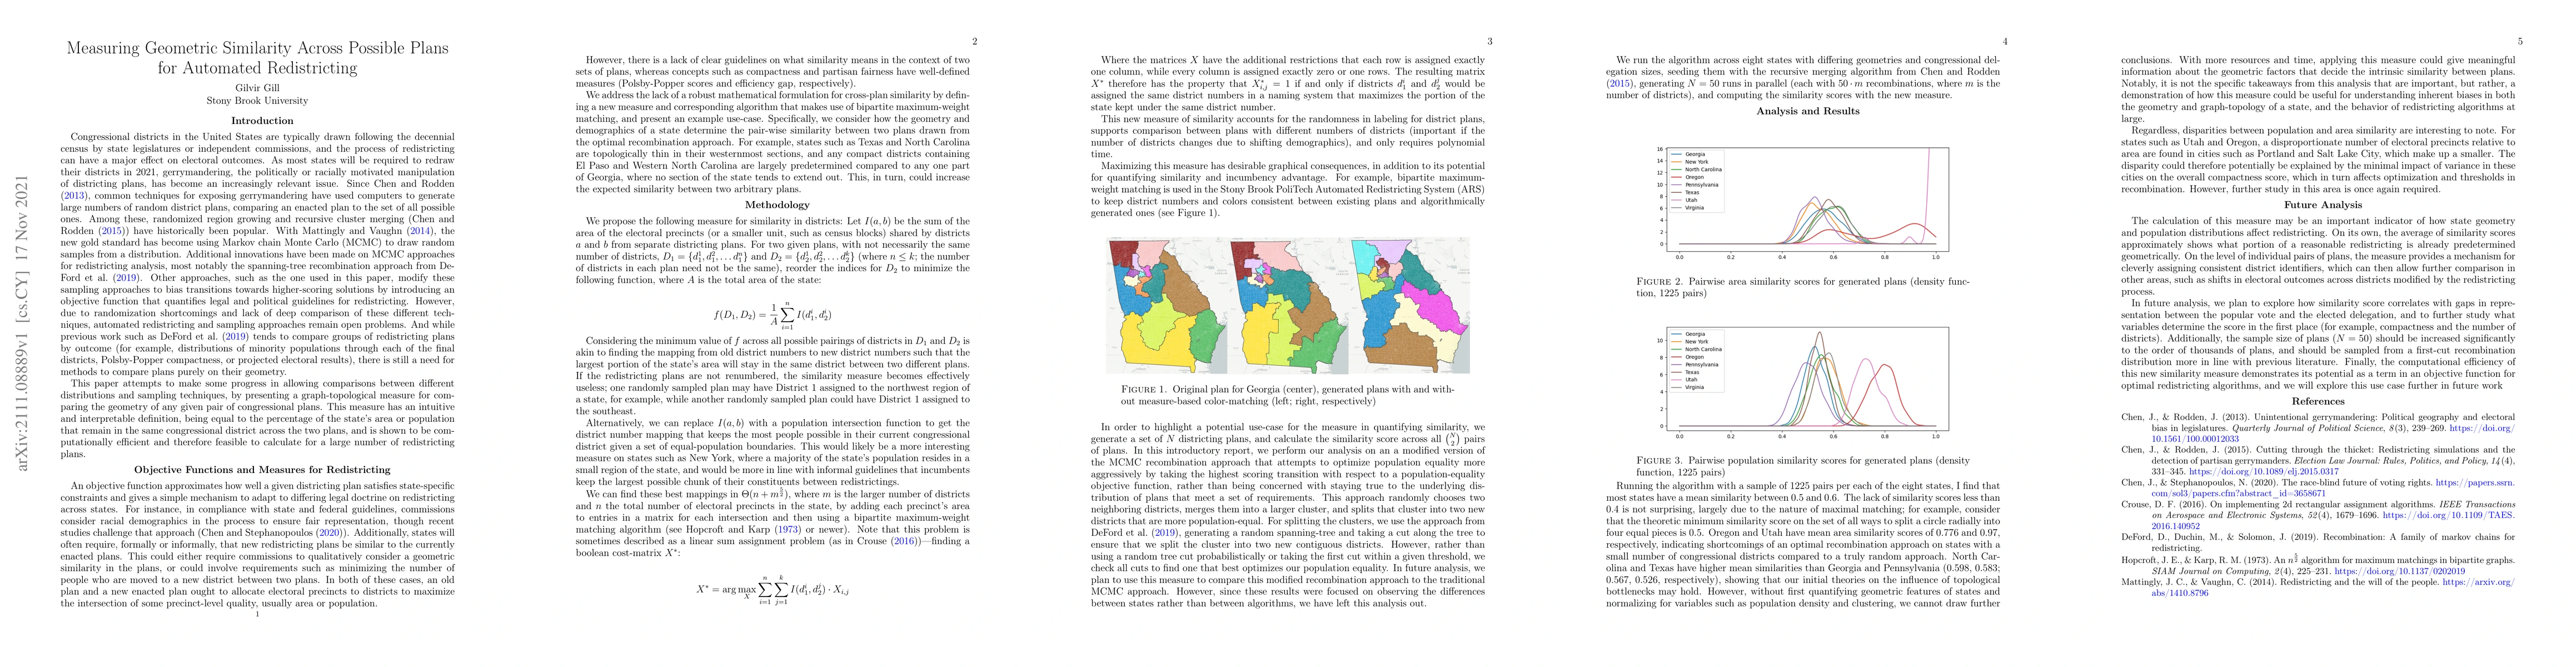
Algorithmic and statistical approaches to congressional redistricting are becoming increasingly valuable tools in courts and redistricting commissions for quantifying gerrymandering in the United States. While there is existing literature covering how various Markov chain Monte Carlo distributions differ in terms of projected electoral outcomes and geometric quantifiers of compactness, there is still work to be done on measuring similarities between different congressional redistricting plans. This paper briefly introduces an intuitive and interpretive measure of similarity, and a corresponding assignment matrix, that corresponds to the percentage of a state's area or population that stays in the same congressional district between two plans. We then show how to calculate this measure in polynomial time and briefly demonstrate some potential use-cases.
AI Key Findings - Failed
Key findings generation failed. Failed to start generation process
Paper Details
PDF Preview
Key Terms
Citation Network
Current paper (gray), citations (green), references (blue)
Display is limited for performance on very large graphs.
Similar Papers
Found 4 papersOn the Complexity of Sampling Redistricting Plans
Tianyu Liu, Moses Charikar, Paul Liu et al.
Simulated redistricting plans for the analysis and evaluation of redistricting in the United States
Kosuke Imai, Melissa Wu, Kevin Wang et al.
Sequential Monte Carlo for Sampling Balanced and Compact Redistricting Plans
Kosuke Imai, Cory McCartan
Multiscale Parallel Tempering for Fast Sampling on Redistricting Plans
Gabriel Chuang, Jonathan C. Mattingly, Gregory Herschlag
No citations found for this paper.
Comments (0)