Summary
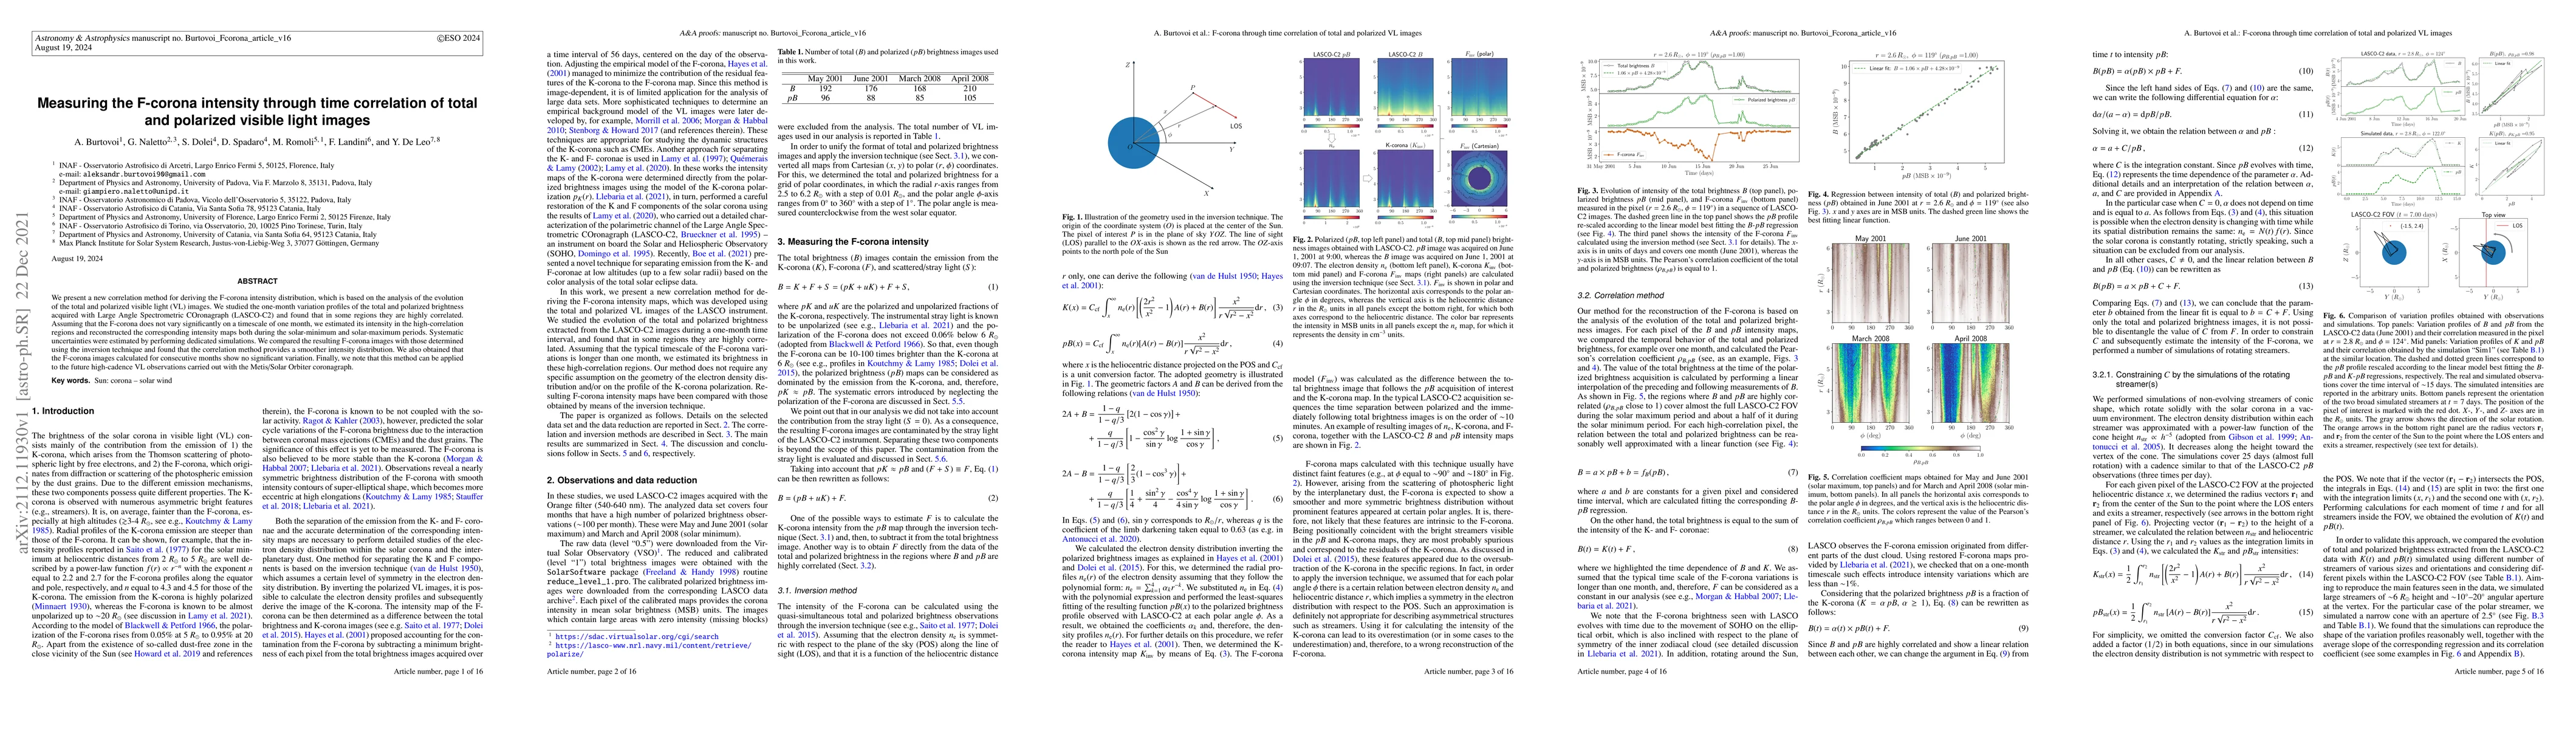
We present a new correlation method for deriving the F-corona intensity distribution, which is based on the analysis of the evolution of the total and polarized visible light (VL) images. We studied the one-month variation profiles of the total and polarized brightness acquired with Large Angle Spectrometric COronagraph (LASCO-C2) and found that in some regions they are highly correlated. Assuming that the F-corona does not vary significantly on a timescale of one month, we estimated its intensity in the high-correlation regions and reconstructed the corresponding intensity maps both during the solar-minimum and solar-maximum periods. Systematic uncertainties were estimated by performing dedicated simulations. We compared the resulting F-corona images with those determined using the inversion technique and found that the correlation method provides a smoother intensity distribution. We also obtained that the F-corona images calculated for consecutive months show no significant variation. Finally, we note that this method can be applied to the future high-cadence VL observations carried out with the Metis/Solar Orbiter coronagraph.
AI Key Findings
Get AI-generated insights about this paper's methodology, results, and significance.
Paper Details
PDF Preview
Key Terms
Citation Network
Current paper (gray), citations (green), references (blue)
Display is limited for performance on very large graphs.
Similar Papers
Found 4 papersProtoplanetary disks in $K_s$-band total intensity and polarized light
Stefano Facchini, Jaehan Bae, Julien Milli et al.
Derived electron densities from linear polarization observations of the visible-light corona during the 14 December 2020 total solar eclipse
Huw Morgan, Brad Ramsey, Liam T. Edwards et al.
| Title | Authors | Year | Actions |
|---|
Comments (0)