Measuring the Overall Complexity of Graphical and Textual IEC 61131-3 Control Software
Publication
Metrics
AI Quick Summary
This paper proposes a set of metrics to measure the complexity of IEC 61131-3 control software, considering various complexity classes like size, data structure, and control flow. It validates the metrics through a questionnaire study and industrial software evaluation, demonstrating their effectiveness for identifying complex software units for refactoring.
Paper Preview
Abstract
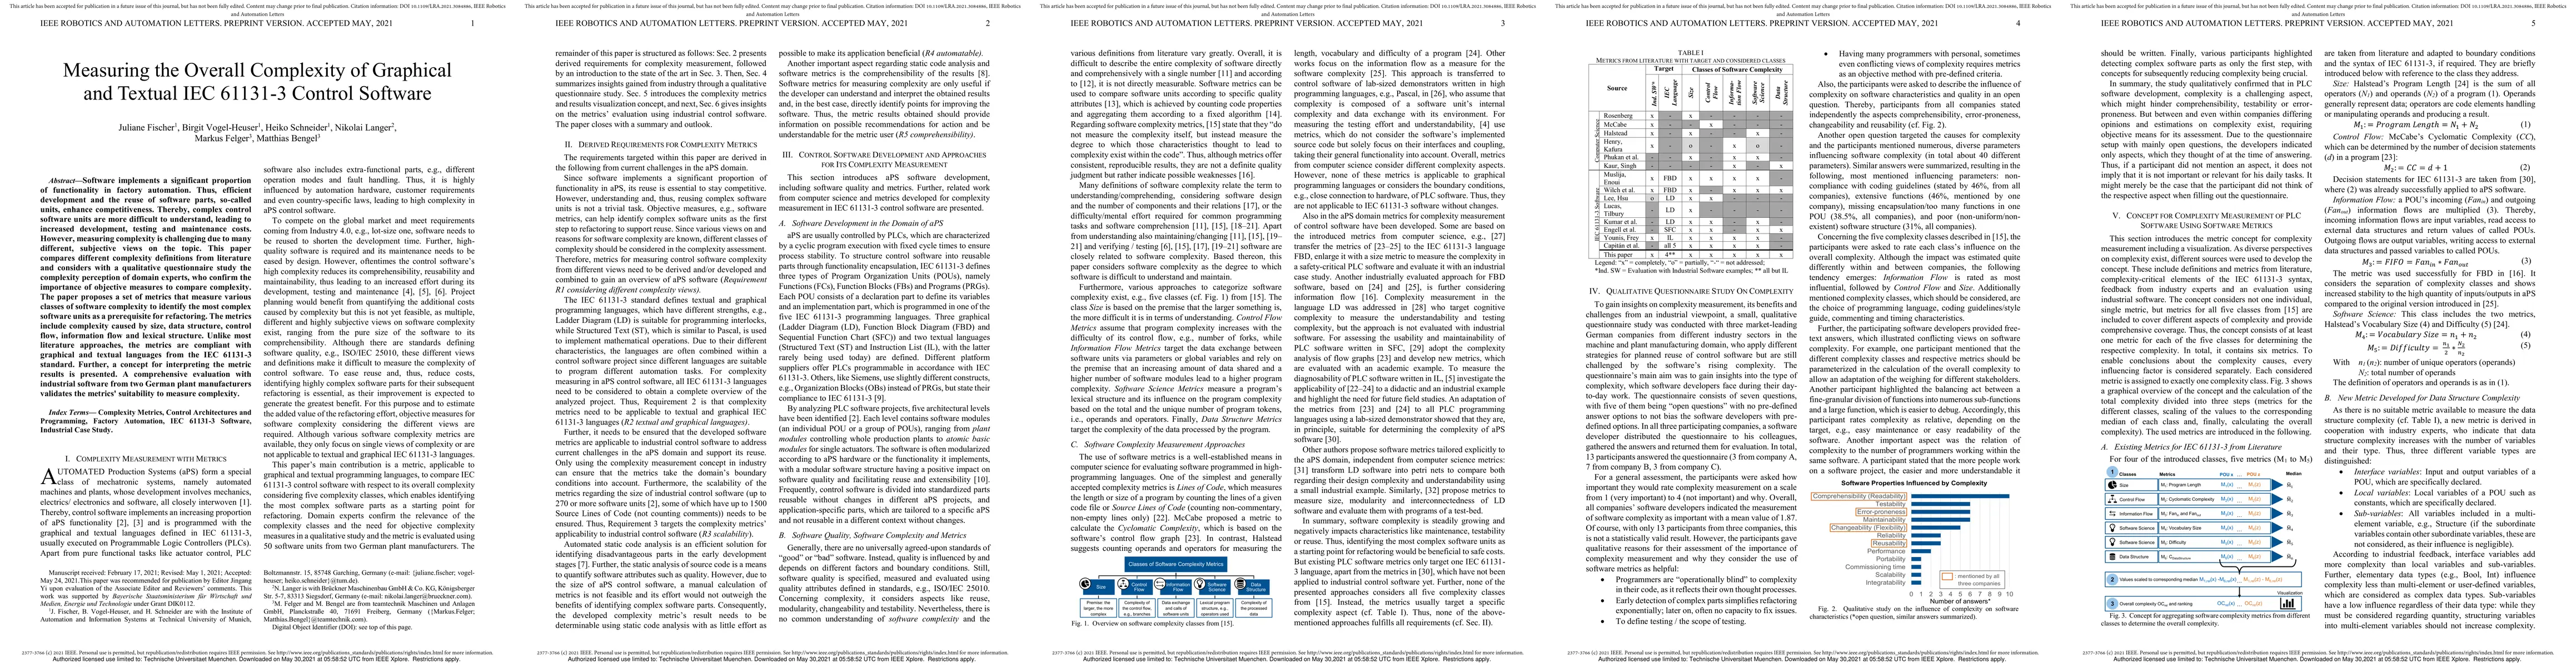
Software implements a significant proportion of functionality in factory automation. Thus, efficient development and the reuse of software parts, so-called units, enhance competitiveness. Thereby, complex control software units are more difficult to understand, leading to increased development, testing and maintenance costs. However, measuring complexity is challenging due to many different, subjective views on the topic. This paper compares different complexity definitions from literature and considers with a qualitative questionnaire study the complexity perception of domain experts, who confirm the importance of objective measures to compare complexity. The paper proposes a set of metrics that measure various classes of software complexity to identify the most complex software units as a prerequisite for refactoring. The metrics include complexity caused by size, data structure, control flow, information flow and lexical structure. Unlike most literature approaches, the metrics are compliant with graphical and textual languages from the IEC 61131-3 standard. Further, a concept for interpreting the metric results is presented. A comprehensive evaluation with industrial software from two German plant manufacturers validates the metrics' suitability to measure complexity.
AI Key Findings
Get AI-generated insights about this paper's methodology, results, significance, and more — seven facets brought into focus.
Impact
Paper Details
Authors
PDF Preview
Key Terms
Citation Network
Current paper (gray), citations (green), references (blue)
Display is limited for performance on very large graphs.
Discussion 0