Publication
Metrics
AI Quick Summary
This paper presents a method for determining the temperature of starspots using multi-filter photometry during exoplanet transits. The technique employs the STarSPot program and LCO's MuSCAT3 instrument to model starspots based on wavelength-dependent contrasts, yielding an average spot temperature of 4500 K $\pm$ 100 K for HAT-P-11.
Paper Preview
Abstract
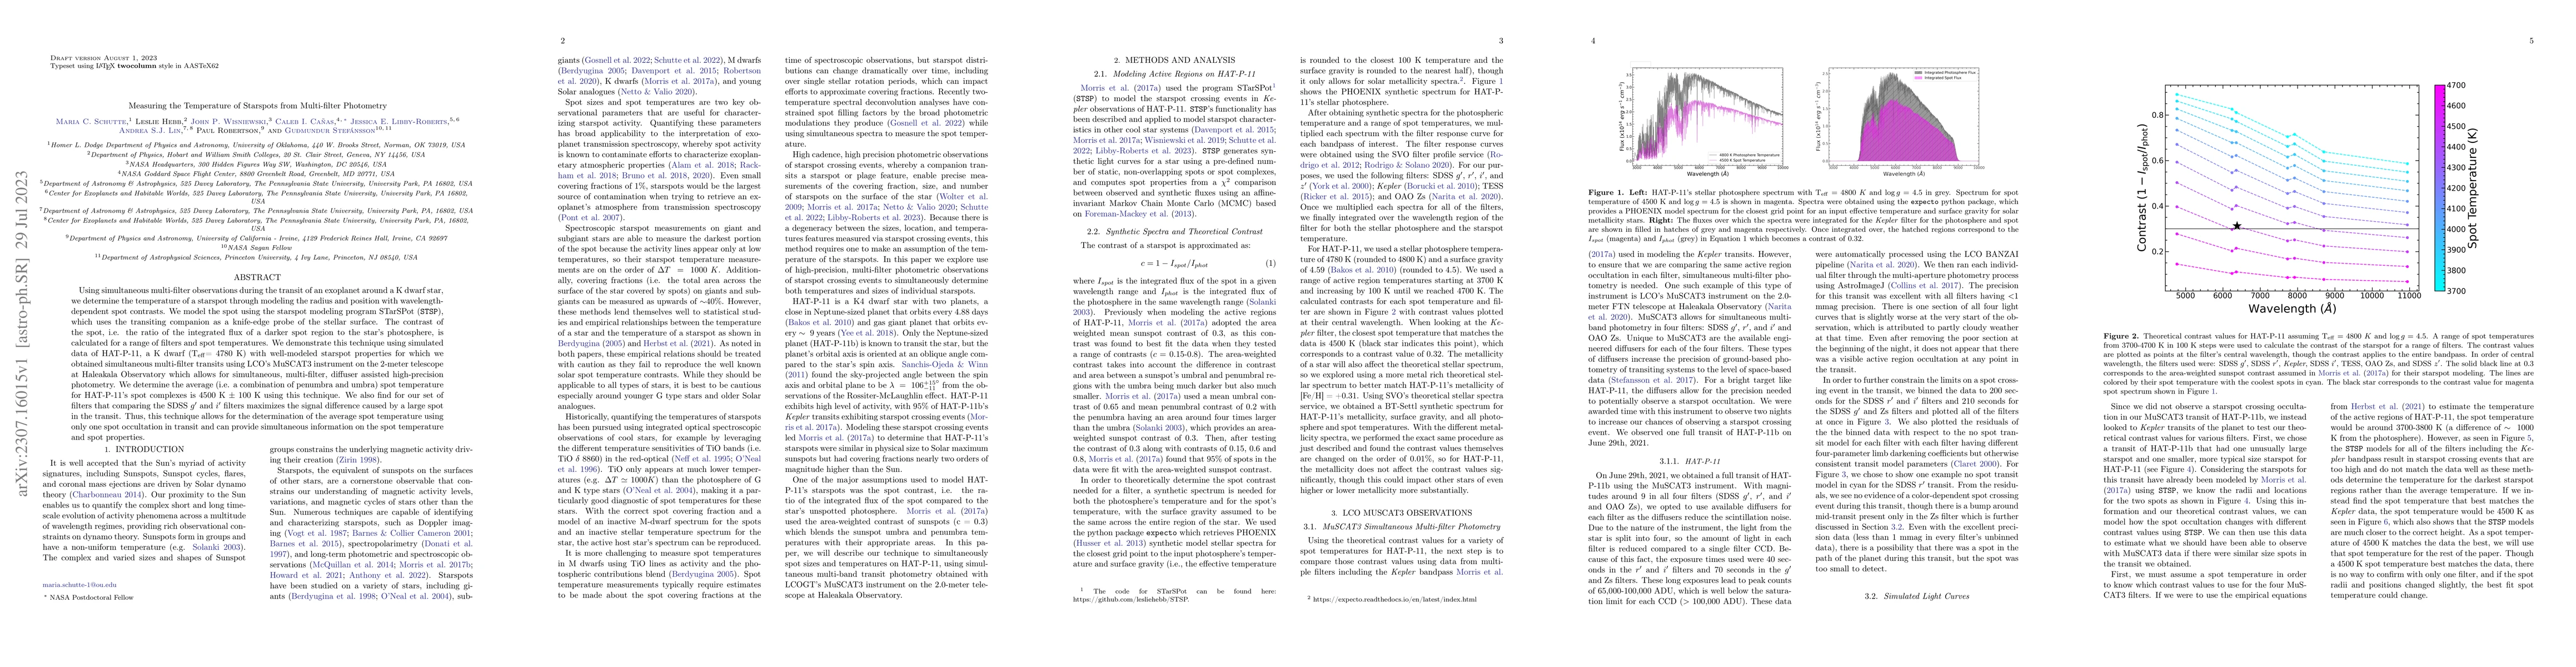
Using simultaneous multi-filter observations during the transit of an exoplanet around a K dwarf star, we determine the temperature of a starspot through modeling the radius and position with wavelength-dependent spot contrasts. We model the spot using the starspot modeling program STarSPot (STSP), which uses the transiting companion as a knife-edge probe of the stellar surface. The contrast of the spot, i.e. the ratio of the integrated flux of a darker spot region to the star's photosphere, is calculated for a range of filters and spot temperatures. We demonstrate this technique using simulated data of HAT-P-11, a K dwarf (T = 4780 K) with well-modeled starspot properties for which we obtained simultaneous multi-filter transits using LCO's MuSCAT3 instrument on the 2-meter telescope at Haleakala Observatory which allows for simultaneous, multi-filter, diffuser assisted high-precision photometry. We determine the average (i.e. a combination of penumbra and umbra) spot temperature for HAT-P-11's spot complexes is 4500 K $\pm$ 100 K using this technique. We also find for our set of filters that comparing the SDSS g' and i' filters maximizes the signal difference caused by a large spot in the transit. Thus, this technique allows for the determination of the average spot temperature using only one spot occultation in transit and can provide simultaneous information on the spot temperature and spot properties.
AI Key Findings
Get AI-generated insights about this paper's methodology, results, significance, and more — seven facets brought into focus.
Impact
Paper Details
Authors
PDF Preview
Key Terms
Citation Network
Current paper (gray), citations (green), references (blue)
Display is limited for performance on very large graphs.
Discussion 0