Publication
Metrics
AI Quick Summary
Summary: This paper introduces a new method to measure volatility clustering in financial markets using high-frequency data, demonstrating consistent clustering across datasets. The study shows that GARCH models significantly reduce this clustering effect, validating the effectiveness of the proposed method.
Paper Preview
Abstract
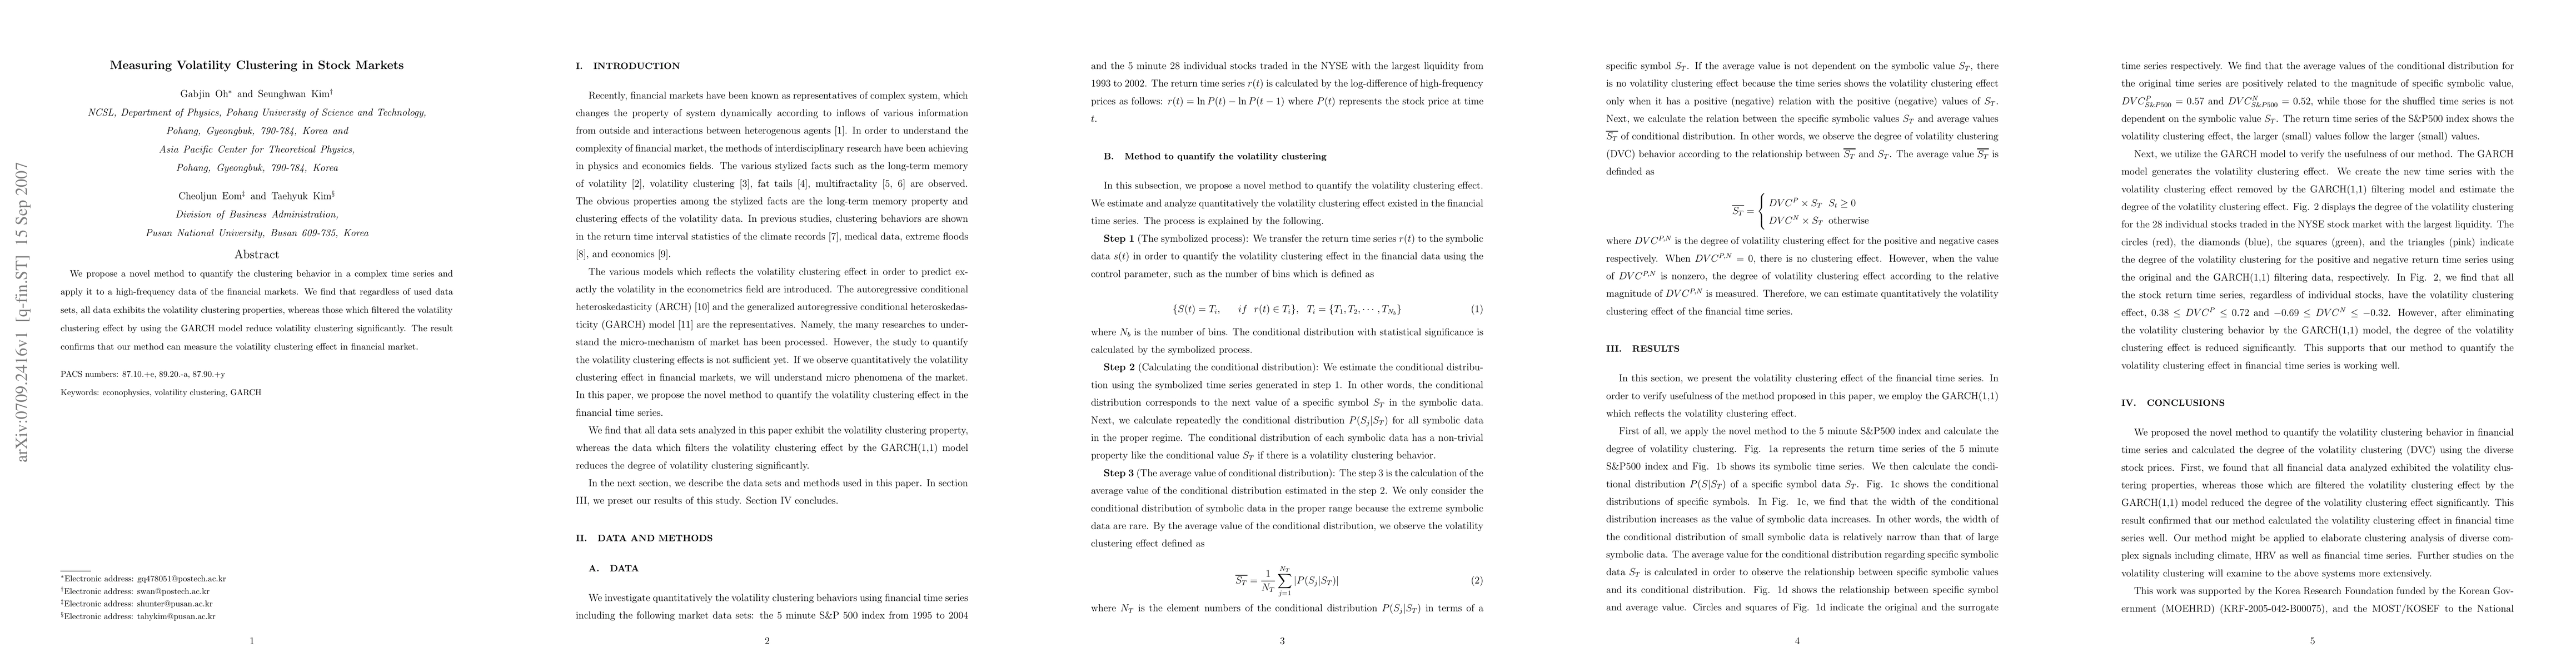
We propose a novel method to quantify the clustering behavior in a complex time series and apply it to a high-frequency data of the financial markets. We find that regardless of used data sets, all data exhibits the volatility clustering properties, whereas those which filtered the volatility clustering effect by using the GARCH model reduce volatility clustering significantly. The result confirms that our method can measure the volatility clustering effect in financial market.
AI Key Findings
Get AI-generated insights about this paper's methodology, results, significance, and more — seven facets brought into focus.
Impact
PDF Preview
Key Terms
Citation Network
Current paper (gray), citations (green), references (blue)
Display is limited for performance on very large graphs.
Discussion 0