Meta-learning and Data Augmentation for Stress Testing Forecasting Models
Publication
Metrics
AI Quick Summary
This paper introduces MAST, a meta-learning and data augmentation framework for forecasting model stress testing, which identifies conditions causing large errors in univariate time series models. Experiments on three datasets indicate MAST's effectiveness in characterizing stress conditions.
Paper Preview
Abstract
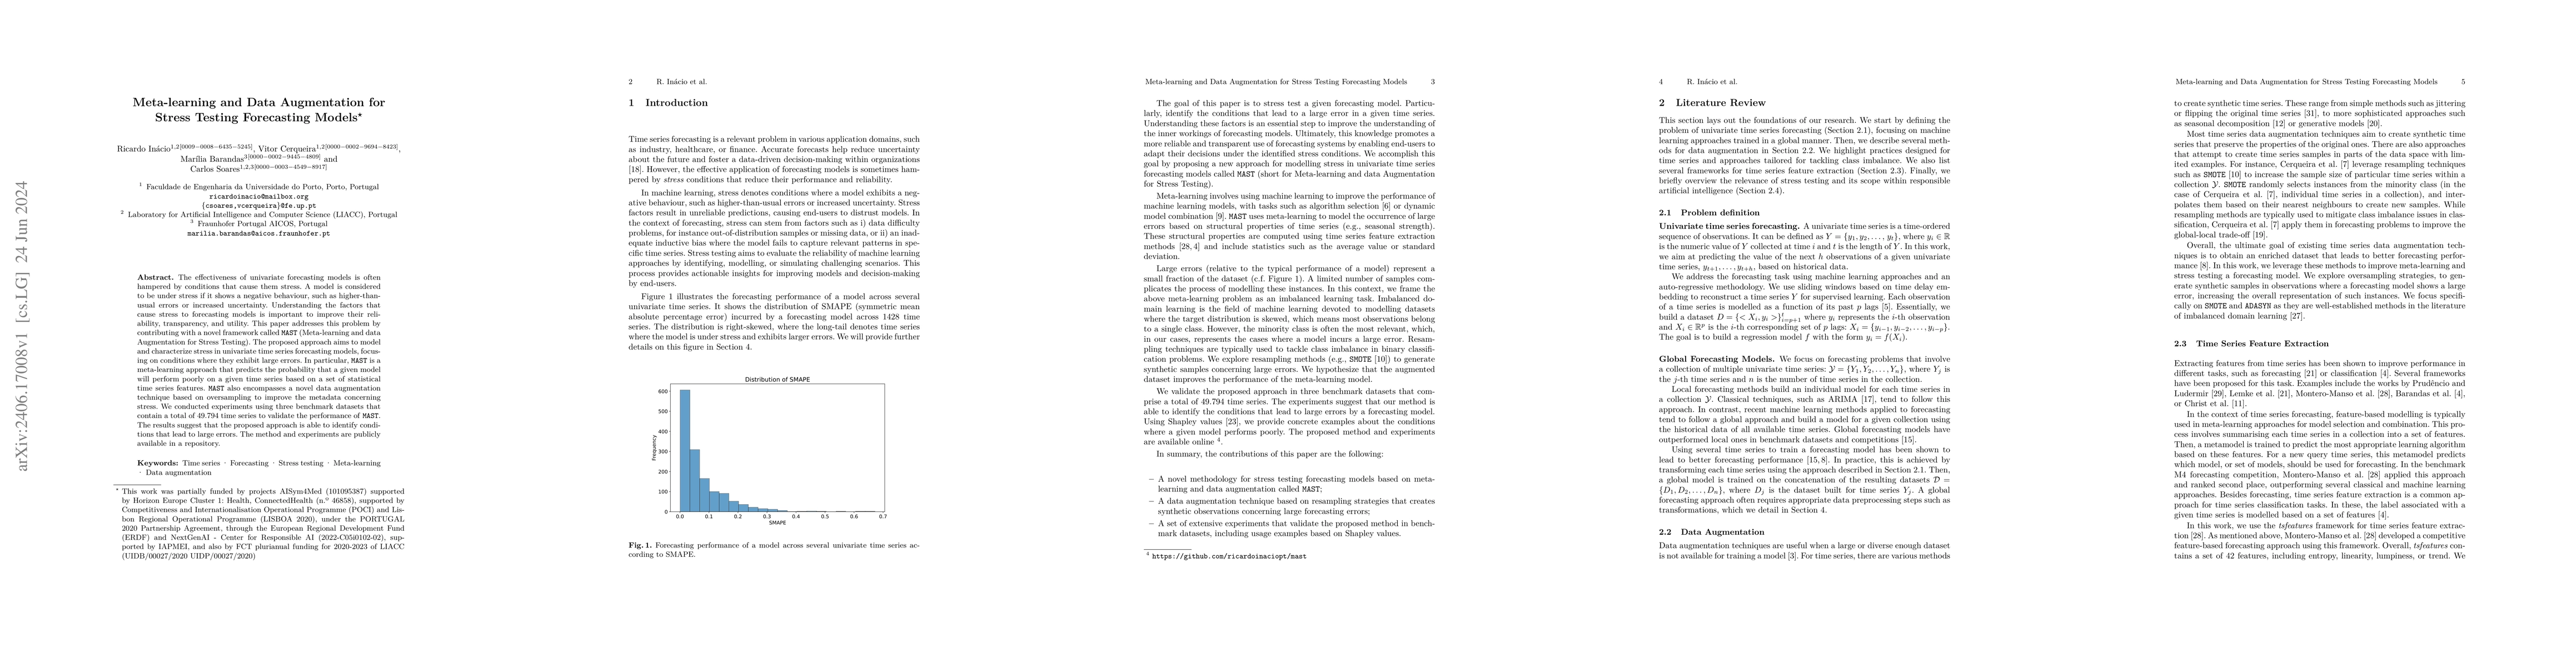
The effectiveness of univariate forecasting models is often hampered by conditions that cause them stress. A model is considered to be under stress if it shows a negative behaviour, such as higher-than-usual errors or increased uncertainty. Understanding the factors that cause stress to forecasting models is important to improve their reliability, transparency, and utility. This paper addresses this problem by contributing with a novel framework called MAST (Meta-learning and data Augmentation for Stress Testing). The proposed approach aims to model and characterize stress in univariate time series forecasting models, focusing on conditions where they exhibit large errors. In particular, MAST is a meta-learning approach that predicts the probability that a given model will perform poorly on a given time series based on a set of statistical time series features. MAST also encompasses a novel data augmentation technique based on oversampling to improve the metadata concerning stress. We conducted experiments using three benchmark datasets that contain a total of 49.794 time series to validate the performance of MAST. The results suggest that the proposed approach is able to identify conditions that lead to large errors. The method and experiments are publicly available in a repository.
AI Key Findings
Get AI-generated insights about this paper's methodology, results, significance, and more — seven facets brought into focus.
Impact
Authors
PDF Preview
Key Terms
Citation Network
Current paper (gray), citations (green), references (blue)
Display is limited for performance on very large graphs.
Discussion 0