Methods and open-source toolkit for analyzing and visualizing challenge results
Publication
Metrics
Paper Preview
Abstract
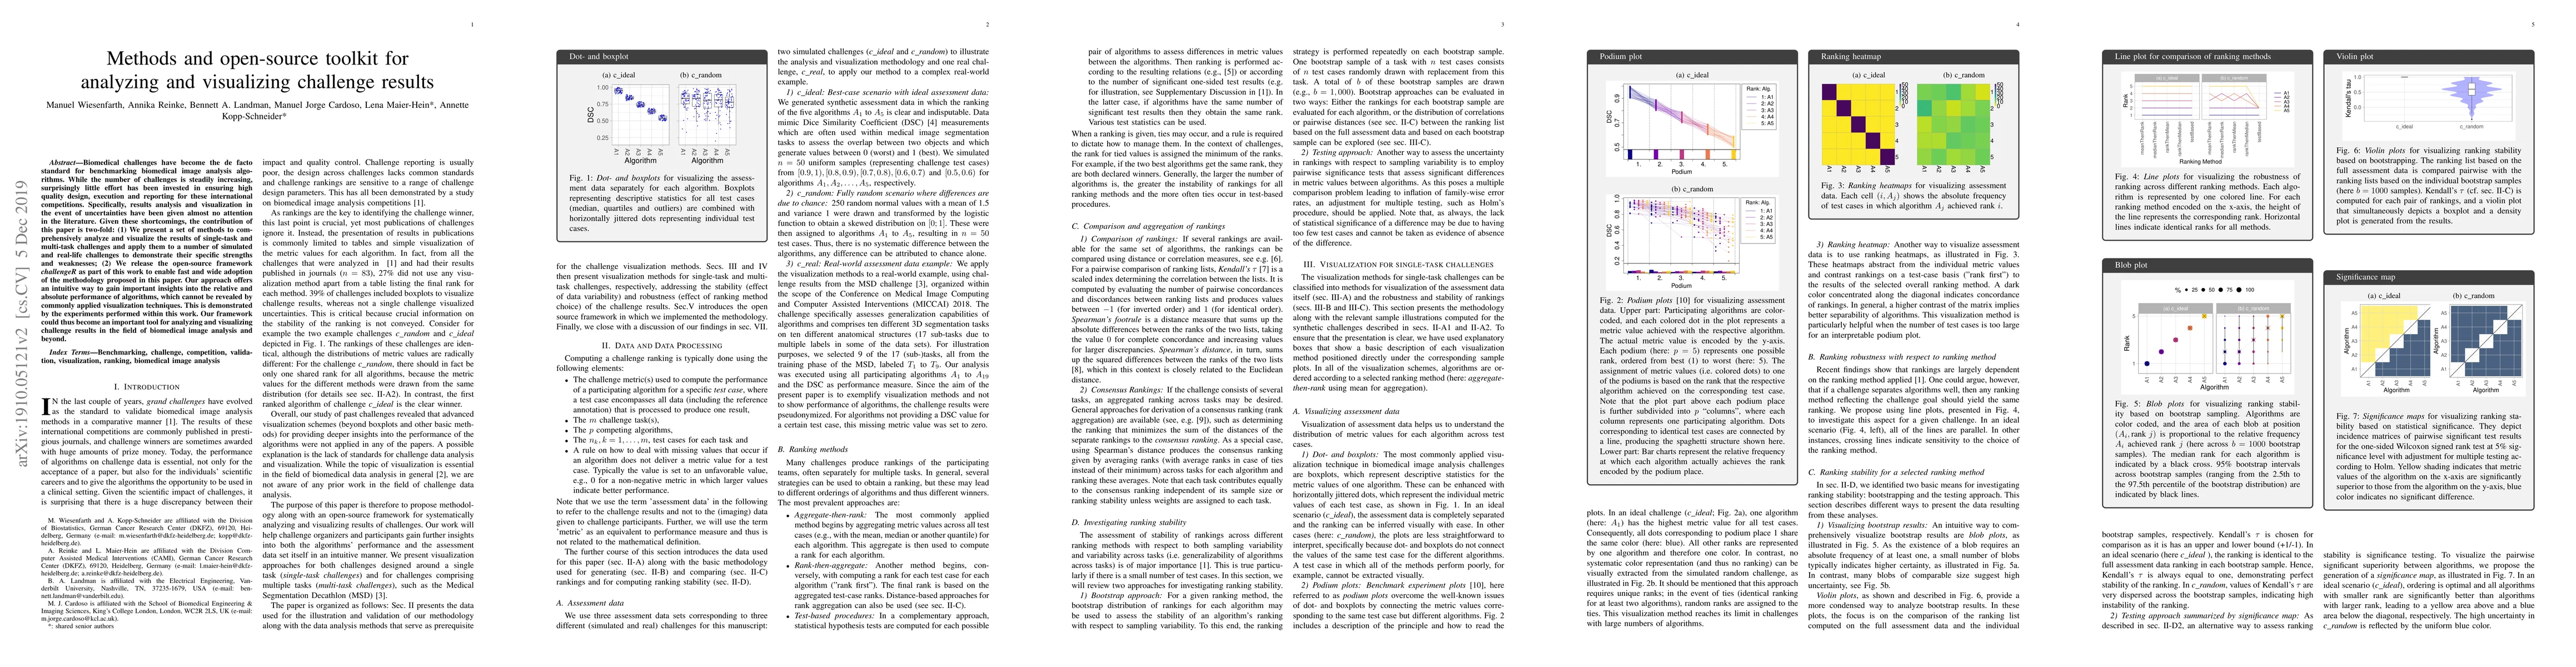
Biomedical challenges have become the de facto standard for benchmarking biomedical image analysis algorithms. While the number of challenges is steadily increasing, surprisingly little effort has been invested in ensuring high quality design, execution and reporting for these international competitions. Specifically, results analysis and visualization in the event of uncertainties have been given almost no attention in the literature. Given these shortcomings, the contribution of this paper is two-fold: (1) We present a set of methods to comprehensively analyze and visualize the results of single-task and multi-task challenges and apply them to a number of simulated and real-life challenges to demonstrate their specific strengths and weaknesses; (2) We release the open-source framework challengeR as part of this work to enable fast and wide adoption of the methodology proposed in this paper. Our approach offers an intuitive way to gain important insights into the relative and absolute performance of algorithms, which cannot be revealed by commonly applied visualization techniques. This is demonstrated by the experiments performed within this work. Our framework could thus become an important tool for analyzing and visualizing challenge results in the field of biomedical image analysis and beyond.
AI Key Findings
Get AI-generated insights about this paper's methodology, results, significance, and more — seven facets brought into focus.
Impact
Paper Details
PDF Preview
Key Terms
Citation Network
Current paper (gray), citations (green), references (blue)
Display is limited for performance on very large graphs.
Discussion 0