ArxivLens

Quick Summary:

This paper introduces two methods to differentiate between polynomial and exponential tails, focusing on the residual coefficient of variation. It proposes a CV-plot, based on the empirical coefficient of variation of conditional exceedances, and new statistics for testing exponentiality using multiple thresholds, with applications and comparisons to other methods demonstrated through simulations.

arXiv Id: 1112.0514
Date Published: 2011-12-21
Date Updated: 2011-12-21

Categories:

Key Terms (TF-IDF):

critical points (0.294)
critical points (0.286)
statistics (0.270)
powers (0.264)
exponential (0.264)
powers (0.260)
exponential (0.258)
statistics (0.255)
coefficient (0.219)
coefficient (0.218)
variation (0.215)
variation (0.206)
introduced (0.187)
points (0.184)
points (0.180)
introduced (0.179)
graphical (0.173)
critical (0.170)
daily (0.169)
thresholds (0.168)
License: http://arxiv.org/licenses/nonexclusive-distrib/1.0/

Summary:

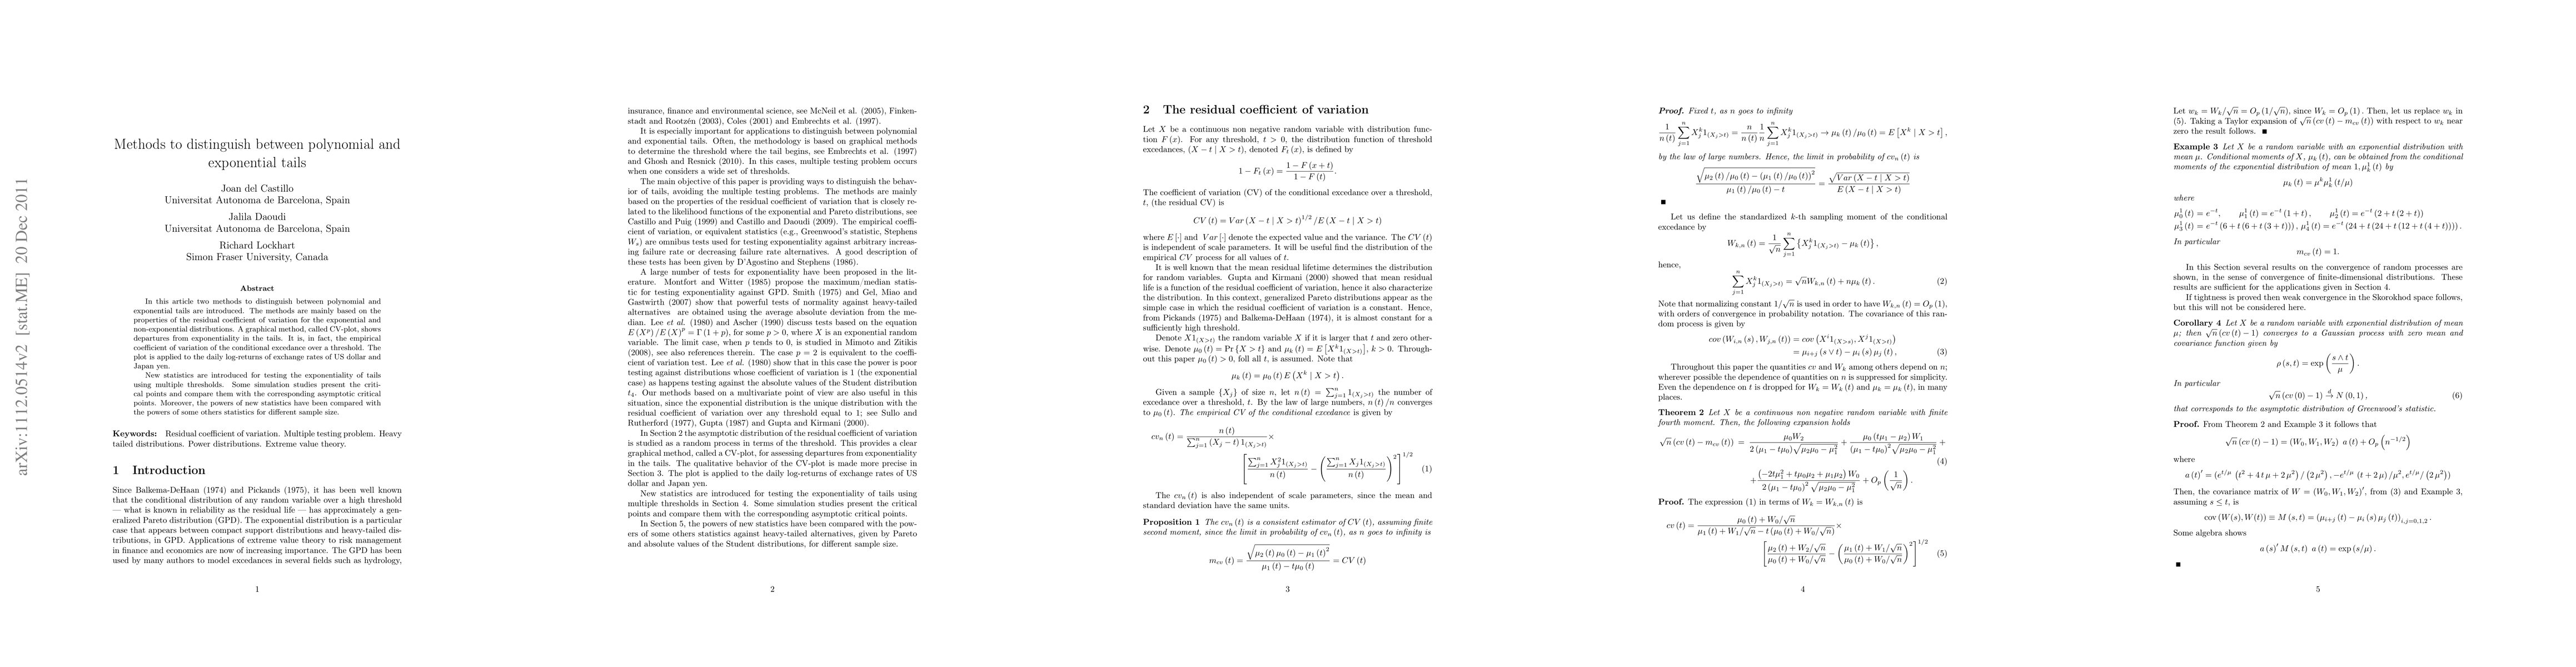
In this article two methods to distinguish between polynomial and exponential tails are introduced. The methods are mainly based on the properties of the residual coefficient of variation for the exponential and non-exponential distributions. A graphical method, called CV-plot, shows departures from exponentiality in the tails. It is, in fact, the empirical coefficient of variation of the conditional excedance over a threshold. The plot is applied to the daily log-returns of exchange rates of US dollar and Japan yen. New statistics are introduced for testing the exponentiality of tails using multiple thresholds. Some simulation studies present the critical points and compare them with the corresponding asymptotic critical points. Moreover, the powers of new statistics have been compared with the powers of some others statistics for different sample size.

Citation & Reference Network Visualization

This graph shows how this paper is connected to other research. The current paper is shown in dark gray, papers that cite it are in green, and papers it references are in blue. You can:

Current Paper
Papers citing this work (Citations)
Papers cited by this work (References)

• Hover over any node to see the paper title

• Click a node to view that paper's details

• Drag nodes to rearrange the graph

• Use the zoom controls (bottom right) to zoom in/out

Citations and References

Title Authors Year Actions
Distinguishing between a power law and a Pareto distribution
J. del Castillo, P. Puig
2023
View Paper
Robust mean change point testing in high-dimensional data with heavy tails
Mengchu Li, Yudong Chen, Tengyao Wang, Yi Yu
2023
View Paper
Asymptotic analysis of generalized Greenwood statistics for very heavy tails
H. Albrecher, Brandon Garcia Flores
2022
View Paper
The Greenwood statistic, stochastic dominance, clustering and heavy tails
M. Arendarczyk, T. Kozubowski, A. Panorska
2021
View Paper
Far-End-Tail Estimation of Queueing System Performance
E. Morozov, I. Peshkova, A. Rumyantsev
2020
View Paper
Far-End-Tail Estimation of Queueing System Performance
E. Morozov, I. V. Peshkova, A. Rumyantsev
2020
View Paper
CleanET: enabling timing validation for complex automotive systems
Sergi Vilardell, Isabel Serra, Hamid Tabani, J. Abella, J. Castillo, F. Cazorla
2020
View Paper
On the Use of Probabilistic Worst-Case Execution Time Estimation for Parallel Applications in High Performance Systems
Matteo Fusi, Fabio Mazzocchetti, Albert Farrés, Leonidas Kosmidis, R. Canal, F. Cazorla, J. Abella
2020
View Paper
On the limits of probabilistic timing analysis
Suzana Milutinovic
2019
View Paper
Testing conditions and estimating parameters in extreme value theory: Application to environmental data
Helena Penalva, D. P. Gomes, M. Neves, Sandra Nunes
2019
View Paper
A Reliable Statistical Analysis of the Best-Fit Distribution for High Execution Times
Xavier Civit, J. Castillo, J. Abella
2018
View Paper
Execution time distributions in embedded safety-critical systems using extreme value theory
J. Castillo, Maria Padilla, J. Abella, F. Cazorla
2017
View Paper
On uses of extreme value theory fit for industrial-quality WCET analysis
Suzana Milutinovic, E. Mezzetti, J. Abella, T. Vardanega, F. Cazorla
2017
View Paper
Measurement-Based Worst-Case Execution Time Estimation Using the Coefficient of Variation
J. Abella, Maria Padilla, J. Castillo, F. Cazorla
2017
View Paper
Distinguishing Log-Concavity from Heavy Tails
S. Asmussen, Jaakko Lehtomaa
2017
View Paper
Modeling extreme values by the residual coefficient of variation
J. Castillo, Maria Padilla
2015
View Paper
Likelihood inference for generalized Pareto distribution
J. Castillo, Isabel Serra
2015
View Paper
Using Markov's Inequality with Power-Of-k Function for Probabilistic WCET Estimation
Sergi Vilardell, Isabel Serra, E. Mezzetti, J. Abella, F. Cazorla, J. Castillo
2022
View Paper
Fitting Tails by the Empirical Residual Coefficient of Variation: The ercv Package
J. Castillo, Isabel Serra, Maria Padilla, D. Moriña
2019
View Paper
Statistical Analysis on
Rakesh Kumar, Ankith Jain, Hyoseung Kim
2018
View Paper
EXTREME VALUE ANALYSIS – A BRIEF OVERVIEW WITH AN APPLICATION TO FLOW DISCHARGE RATE DATA IN A HYDROMETRIC STATION IN THE NORTH OF PORTUGAL
Helena Penalva, Sandra Nunes, M. Neves
2016
View Paper

Comments (0)

This website uses cookies to ensure you get the best experience. Learn more