Publication
Metrics
AI Quick Summary
High-luminosity quasars were monitored for two years to measure MgII line variability, showing 10%-24% peak-to-peak changes and 3%-8% rms variations in the rest-frame UV continuum. The study demonstrated the feasibility of using MgII for reverberation mapping at intermediate redshifts.
Paper Preview
Abstract
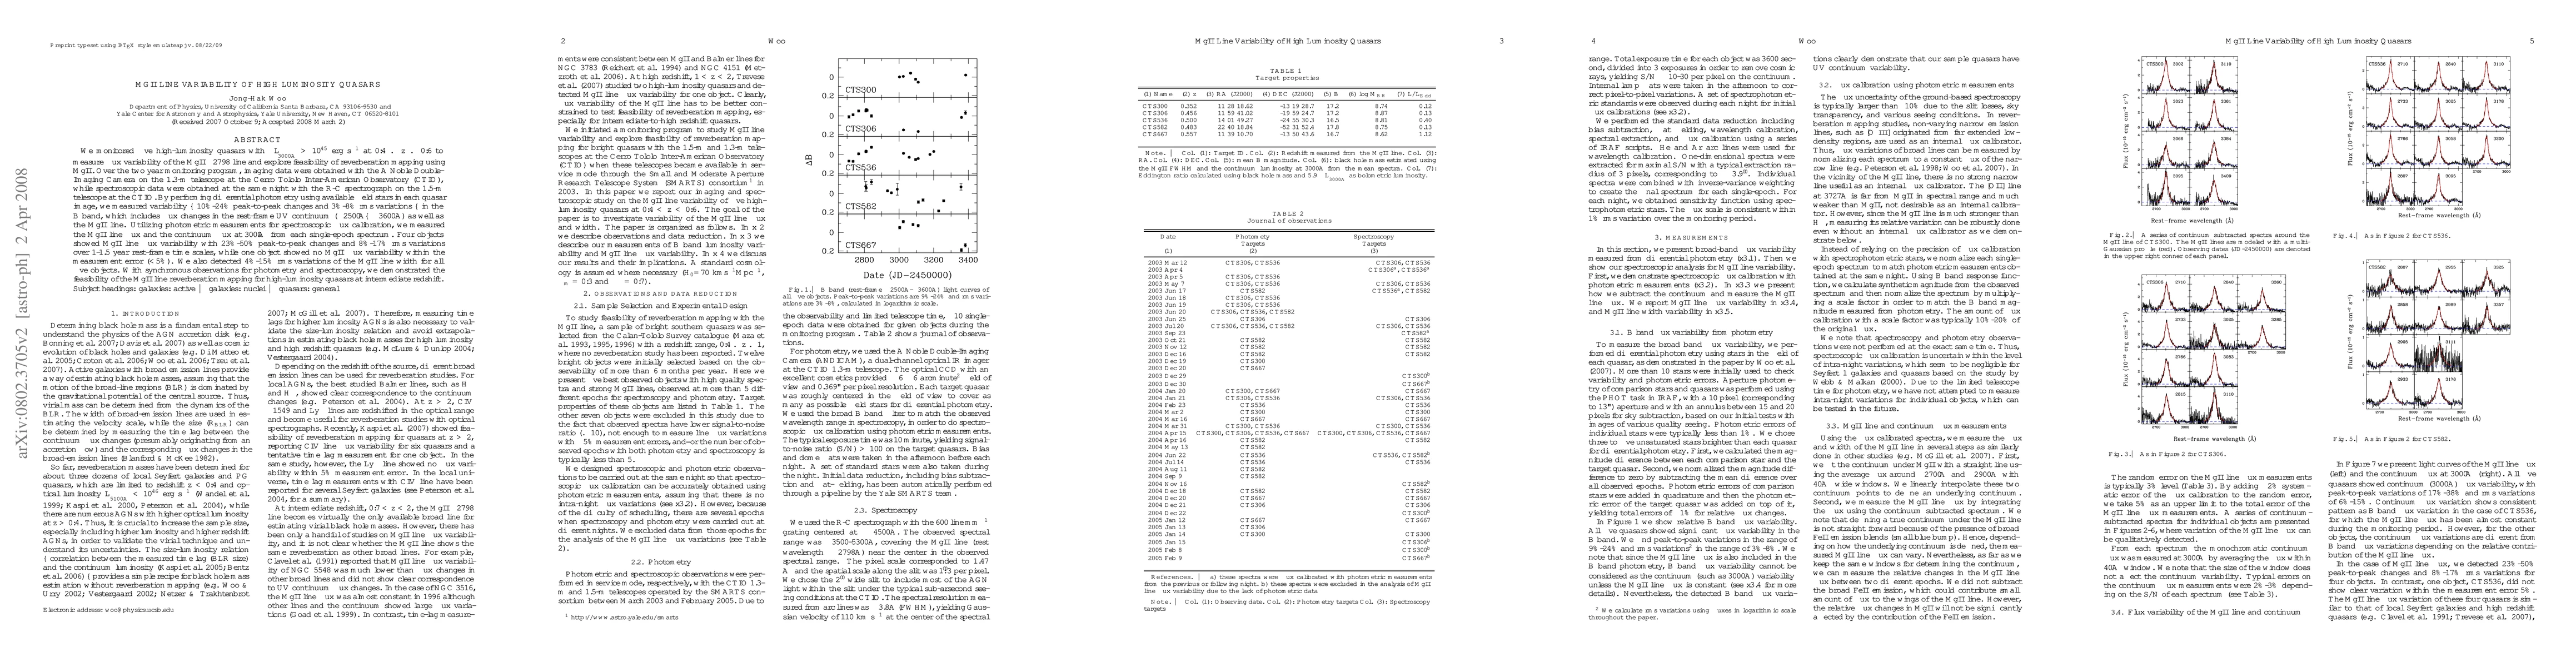
We monitored five high-luminosity quasars with lambda L_{3000A} > 10^45 erg s^-1 at 0.4 < z < 0.6 to measure flux variability of the MgII 2798 line and explore feasibility of reverberation mapping using MgII. Over the two year monitoring program, imaging data were obtained with the A Noble Double-Imaging Camera on the 1.3-m telescope at the Cerro Tololo Inter-American Observatory (CTIO), while spectroscopic data were obtained at the same night with the R-C spectrograph on the 1.5-m telescope at the CTIO. By performing differencial photometry using available field stars in each quasar image, we measured variability -- 10%-24% peak-to-peak changes and 3%-8% rms variations -- in the B band, which includes flux changes in the rest-frame UV continuum (~2500A -- ~3600A) as well as the MgII line. Utilizing photometric measurements for spectroscopic flux calibration, we measured the MgII line flux and the continuum flux at 3000\AA from each single-epoch spectrum. Four objects showed MgII line flux variability with 23%-50% peak-to-peak changes and 8%-17% rms variations over 1-1.5 year rest-frame time scales, while one object showed no MgII flux variability within the measurement error (<5%). We also detected 4%-15% rms variations of the MgII line width for all five objects. With synchronous observations for photometry and spectroscopy, we demonstrated the feasibility of the MgII line reverberation mapping for high-luminosity quasars at intermediate redshift.
AI Key Findings
Get AI-generated insights about this paper's methodology, results, significance, and more — seven facets brought into focus.
Impact
Paper Details
PDF Preview
Key Terms
Citation Network
Current paper (gray), citations (green), references (blue)
Display is limited for performance on very large graphs.
Discussion 0