The Mini-VLAT is a concise yet reliable 12-item test derived from the 53-item Visualization Literacy Assessment Test (VLAT), validated by experts and showing strong correlation with the original test, making it a practical tool for assessing visualization literacy. Its effectiveness is further demonstrated by its positive correlation with participants' aptitude for learning new visualizations.
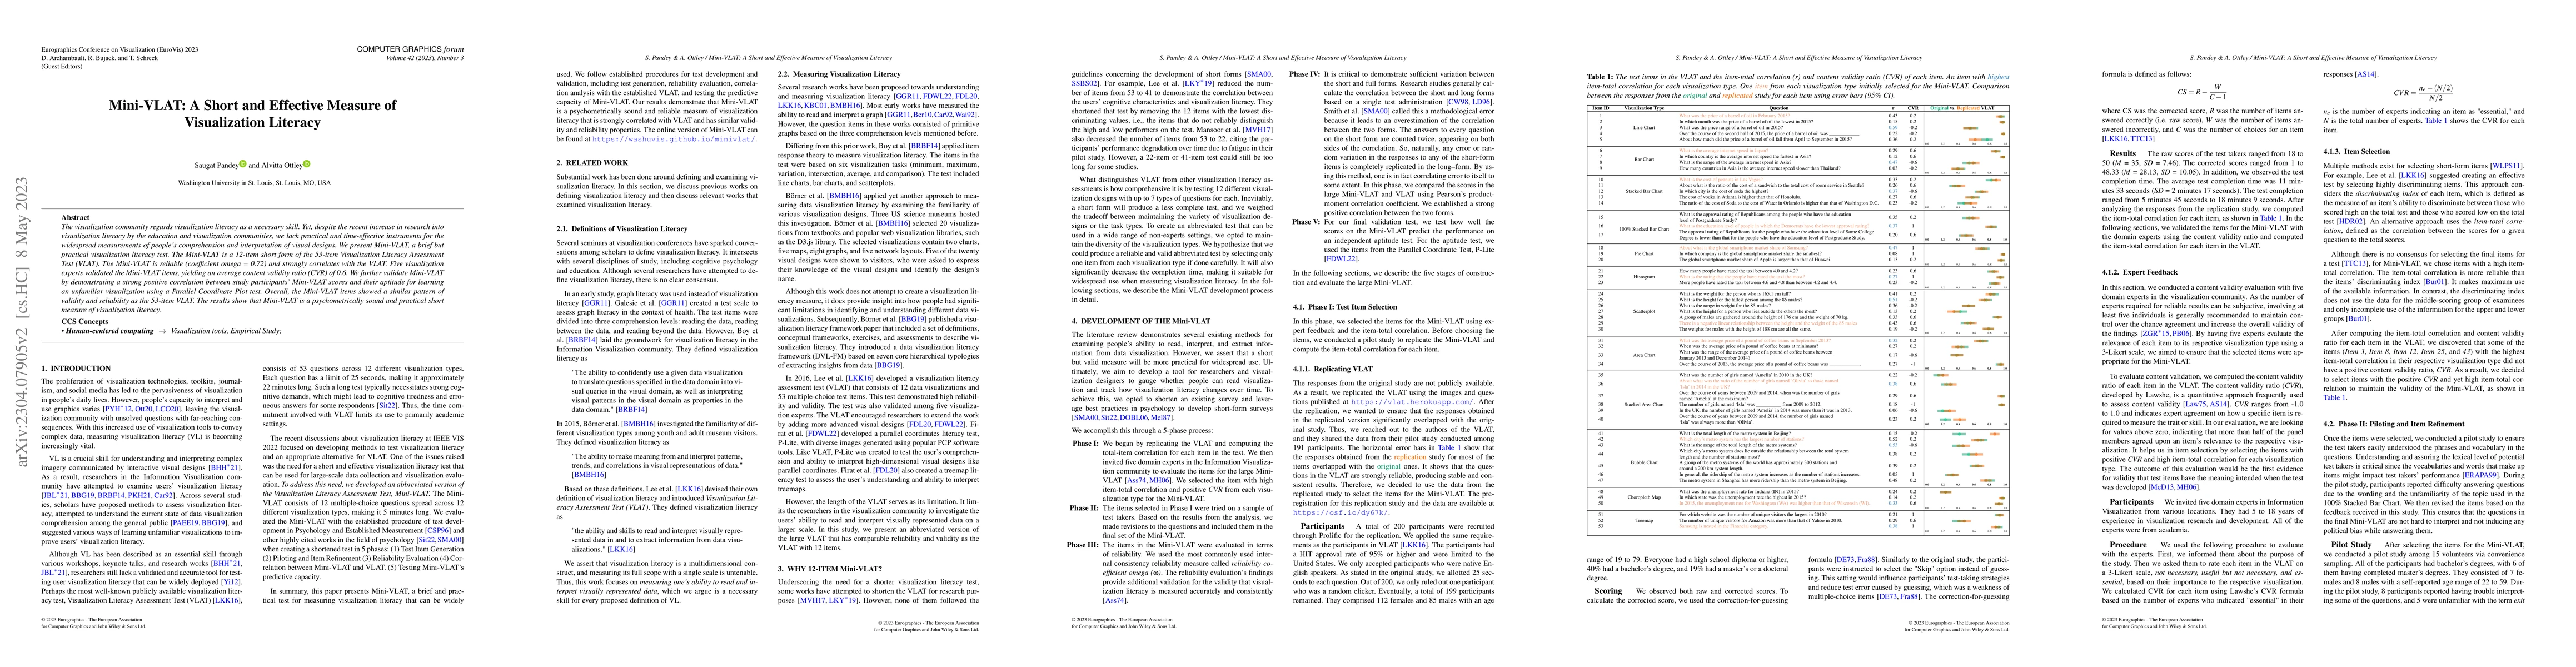
The visualization community regards visualization literacy as a necessary skill. Yet, despite the recent increase in research into visualization literacy by the education and visualization communities, we lack practical and time-effective instruments for the widespread measurements of people's comprehension and interpretation of visual designs. We present Mini-VLAT, a brief but practical visualization literacy test. The Mini-VLAT is a 12-item short form of the 53-item Visualization Literacy Assessment Test (VLAT). The Mini-VLAT is reliable (coefficient omega = 0.72) and strongly correlates with the VLAT. Five visualization experts validated the Mini-VLAT items, yielding an average content validity ratio (CVR) of 0.6. We further validate Mini-VLAT by demonstrating a strong positive correlation between study participants' Mini-VLAT scores and their aptitude for learning an unfamiliar visualization using a Parallel Coordinate Plot test. Overall, the Mini-VLAT items showed a similar pattern of validity and reliability as the 53-item VLAT. The results show that Mini-VLAT is a psychometrically sound and practical short measure of visualization literacy.
Get AI-generated insights about this paper's methodology, results, and significance.
Current paper (gray), citations (green), references (blue)
Matthew Kay, Yiren Ding, Lane Harrison et al.
Shusen Liu, Zhimin Li, Haichao Miao et al.
Alvitta Ottley, Saugat Pandey
Daniel Weiskopf, Kuno Kurzhals, Seyda Öney et al.
Title | Authors | Year | Actions |
---|---|---|---|
Benchmarking Visual Language Models on Standardized Visualization Literacy Tests
|
Saugat Pandey, Alvitta Ottley
|
2025
|
View Paper |
Trustworthy by Design: The Viewer's Perspective on Trust in Data Visualization
|
O. McKinley, Saugat Pandey, Alvitta Ottley
|
2025
|
View Paper |
Do LLMs Have Visualization Literacy? An Evaluation on Modified Visualizations to Test Generalization in Data Interpretation
|
Jiayi Hong, Christian Seto, Arlen Fan, Ross Maciejewski
|
2025
|
View Paper |
Increasing Visual Literacy With Collaborative Foraging, Annotation, Curation, and Critique
|
Rebecca Marie Williams, Afrin Unnisa Syed, Krishna Vamsi Kurumaddali
|
2024
|
View Paper |
The State of the Art in User‐Adaptive Visualizations
|
Fernando J. Yanez, Cristina Conati, Alvitta Ottley, Carolina Nobre
|
2024
|
View Paper |
Designing and Evaluating Sampling Strategies for Multiple-Forecast Visualization (MFV)
|
Ruishi Zou, Siyi Wu, Bingsheng Yao, Dakuo Wang, Lace M. Padilla
|
2024
|
View Paper |
GLAT: The Generative AI Literacy Assessment Test
|
Yueqiao Jin, Roberto Martínez-Maldonado, D. Gašević, Lixiang Yan
|
2024
|
View Paper |
MAVIL: Design of a Multidimensional Assessment of Visual Data Literacy and its Application in a Representative Survey
|
Antonia Saske, T. Möller, Laura Koesten, Judith Staudner, Sylvia Kritzinger
|
2024
|
View Paper |
An Inductive Approach for Identification of Barriers to PCP Literacy
|
Chandana Srinivas, Elif E. Firat, R. Laramee, Alark Joshi
|
2024
|
View Paper |
Assessing Data Visualization Literacy: Design Implementation and Analysis of a Comprehensive Test
|
A. Rodrigues, G. D. J. Barbosa, Hélio Côrtes Vieira Lopes, Simone Diniz Junqueira Barbosa
|
2024
|
View Paper |
The Visualization JUDGE: Can Multimodal Foundation Models Guide Visualization Design Through Visual Perception?
|
Matthew Berger, Shusen Liu
|
2024
|
View Paper |
Testing the Test: Observations When Assessing Visualization Literacy of Domain Experts
|
Seyda Öney, Moataz Abdelaal, K. Kurzhals, Paul Betz, Cordula Kropp, Daniel Weiskopf
|
2024
|
View Paper |
What University Students Learn In Visualization Classes
|
Maryam Hedayati, Matthew Kay
|
2024
|
View Paper |
Exploring annotation taxonomy in grouped bar charts: A qualitative classroom study
|
Md Dilshadur Rahman, Ghulam Jilani Quadri, D. Szafir, Paul Rosen
|
2024
|
View Paper |
Motion-Based Visual Encoding Can Improve Performance on Perceptual Tasks with Dynamic Time Series
|
Songwen Hu, Ouxun Jiang, Jeffrey Riedmiller, Cindy Xiong Bearfield
|
2024
|
View Paper |
Building and Eroding: Exogenous and Endogenous Factors that Influence Subjective Trust in Visualization
|
R. Crouser, Syrine Matoussi, Lan Kung, Saugat Pandey, O. McKinley, Alvitta Ottley
|
2024
|
View Paper |
Advancing Multimodal Large Language Models in Chart Question Answering with Visualization-Referenced Instruction Tuning
|
Xingchen Zeng, Haichuan Lin, Yilin Ye, Wei Zeng
|
2024
|
View Paper |
What Can Interactive Visualization Do for Participatory Budgeting in Chicago?
|
Alex Kale, Danni Liu, Maria Gabriela Ayala, Harper Schwab, Andrew McNutt
|
2024
|
View Paper |
Visualization Literacy of Multimodal Large Language Models: A Comparative Study
|
Zhimin Li, Haichao Miao, Valerio Pascucci, Shusen Liu
|
2024
|
View Paper |
Enhancing Data Literacy On-demand: LLMs as Guides for Novices in Chart Interpretation.
|
Kiroong Choe, Chaerin Lee, S. Lee, Jiwon Song, Aeri Cho, Nam Wook Kim, Jinwook Seo
|
2024
|
View Paper |
Toward a More Comprehensive Understanding of Visualization Literacy
|
Lily W. Ge, Maryam Hedayati, Yuanling Cui, Yiren Ding, Karen Bonilla, Alark Joshi, Alvitta Ottley, Benjamin Bach, Bum Chul Kwon, David N. Rapp, Evan Peck, Lace M. Padilla, Michael Correll, M. Borkin, Lane Harrison, Matthew Kay
|
2024
|
View Paper |
Reading Between the Pixels: Investigating the Barriers to Visualization Literacy
|
Carolina Nobre, Kehang Zhu, Eric Mörth, Hanspeter Pfister, Johanna Beyer
|
2024
|
View Paper |
Evaluating the Recommendations of LLMs to Teach a Visualization Technique Using Bloom's Taxonomy
|
Alark Joshi, Chandana Srinivas, Elif E. Firat, R. Laramee
|
2024
|
View Paper |
A simple model for the charm structure function of nuclei
|
G. Boroun
|
2023
|
View Paper |
Educational Data Comics: What can Comics do for Education in Visualization?
|
Magdalena Boucher, Benjamin Bach, Christina Stoiber, Zezhong Wang, Wolfgang Aigner
|
2023
|
View Paper |
The Gulf of Interpretation: From Chart to Message and Back Again
|
Christian Knoll, T. Möller, Kathleen Gregory, Laura Koesten
|
2023
|
View Paper |
Construct and Play: Engaging Students with Visualizations through Playful Methods
|
Magdaléna Kejstová, Christina Stoiber, Magdalena Boucher, Martin Kandlhofer, Simone Kriglstein, Wolfgang Aigner
|
2023
|
View Paper |
Beyond English: Centering Multilingualism in Data Visualization
|
Noëlle Rakotondravony, Priya Dhawka, Melanie Bancilhon
|
2023
|
View Paper |
Challenges and Opportunities in Data Visualization Education: A Call to Action
|
B. Bach, Mandy Keck, Fateme Rajabiyazdi, Tatiana Losev, Isabel Meirelles, J. Dykes, R. Laramee, Mashael AlKadi, Christina Stoiber, Samuel Huron, Charles Perin, Luiz Morais, W. Aigner, Doris Kosminsky, Magdalena Boucher, S. Knudsen, A. Manataki, J. Aerts, Uta Hinrichs, J. C. Roberts, Sheelagh Carpendale
|
2023
|
View Paper |
Do You Trust What You See? Toward A Multidimensional Measure of Trust in Visualization
|
Saugat Pandey, O. McKinley, R. Crouser, Alvitta Ottley
|
2023
|
View Paper |
Show Me the GIFference! Using data-GIFs as Educational Tools
|
Lorenzo Amabili, TU Wien, M. Gröller, R. Raidou
|
2024
|
View Paper |
Comments (0)