Publication
Metrics
AI Quick Summary
This paper explores the use of full lightcurve analysis to minimize follow-up for space-based transit surveys by identifying and eliminating false-positive candidates. The authors demonstrate that high signal-to-noise lightcurves can distinguish between blended stellar systems and true exoplanets, significantly reducing the number of candidates requiring follow-up observation.
Paper Preview
Abstract
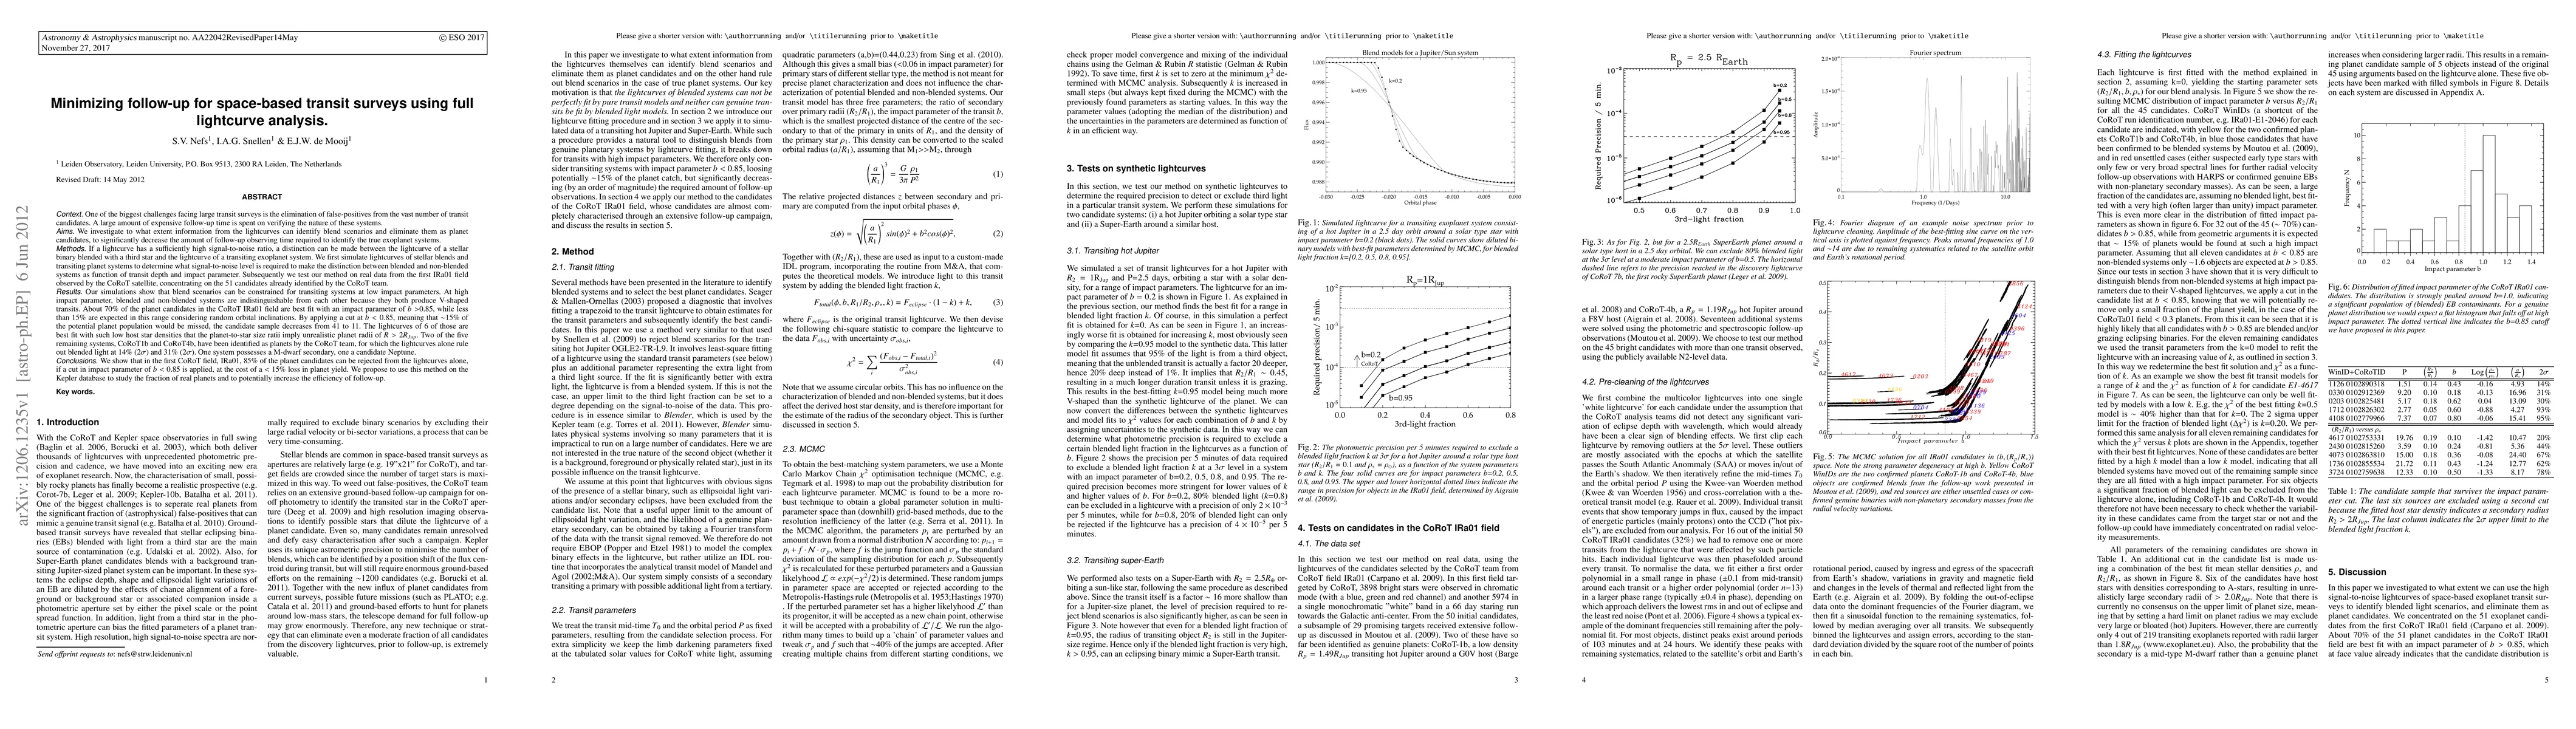
One of the biggest challenges facing large transit surveys is the elimination of false-positives from the vast number of transit candidates. We investigate to what extent information from the lightcurves can identify blend scenarios and eliminate them as planet candidates, to significantly decrease the amount of follow-up observing time required to identify the true exoplanet systems. If a lightcurve has a sufficiently high signal-to-noise ratio, a distinction can be made between the lightcurve of a stellar binary blended with a third star and the lightcurve of a transiting exoplanet system. We perform simulations to determine what signal-to-noise level is required to make the distinction between blended and non-blended systems as function of transit depth and impact parameter. Subsequently we test our method on real data from the first IRa01 field observed by the CoRoT satellite, concentrating on the 51 candidates already identified by the CoRoT team. About 70% of the planet candidates in the CoRoT IRa01 field are best fit with an impact parameter of b>0.85, while less than 15% are expected in this range considering random orbital inclinations. By applying a cut at b<0.85, meaning that ~15% of the potential planet population would be missed, the candidate sample decreases from 41 to 11. The lightcurves of 6 of those are best fit with such low host star densities that the planet-to-star size ratii imply unrealistic planet radii of R>2RJup. Two of the five remaining systems, CoRoT1b and CoRoT4b, have been identified as planets by the CoRoT team, for which the lightcurves alone rule out blended light at 14% (2sigma) and 31% (2sigma). We propose to use this method on the Kepler database to study the fraction of real planets and to potentially increase the efficiency of follow-up.
AI Key Findings
Get AI-generated insights about this paper's methodology, results, significance, and more — seven facets brought into focus.
Impact
Paper Details
PDF Preview
Key Terms
Citation Network
Current paper (gray), citations (green), references (blue)
Display is limited for performance on very large graphs.
Discussion 0