Publication
Metrics
Paper Preview
Abstract
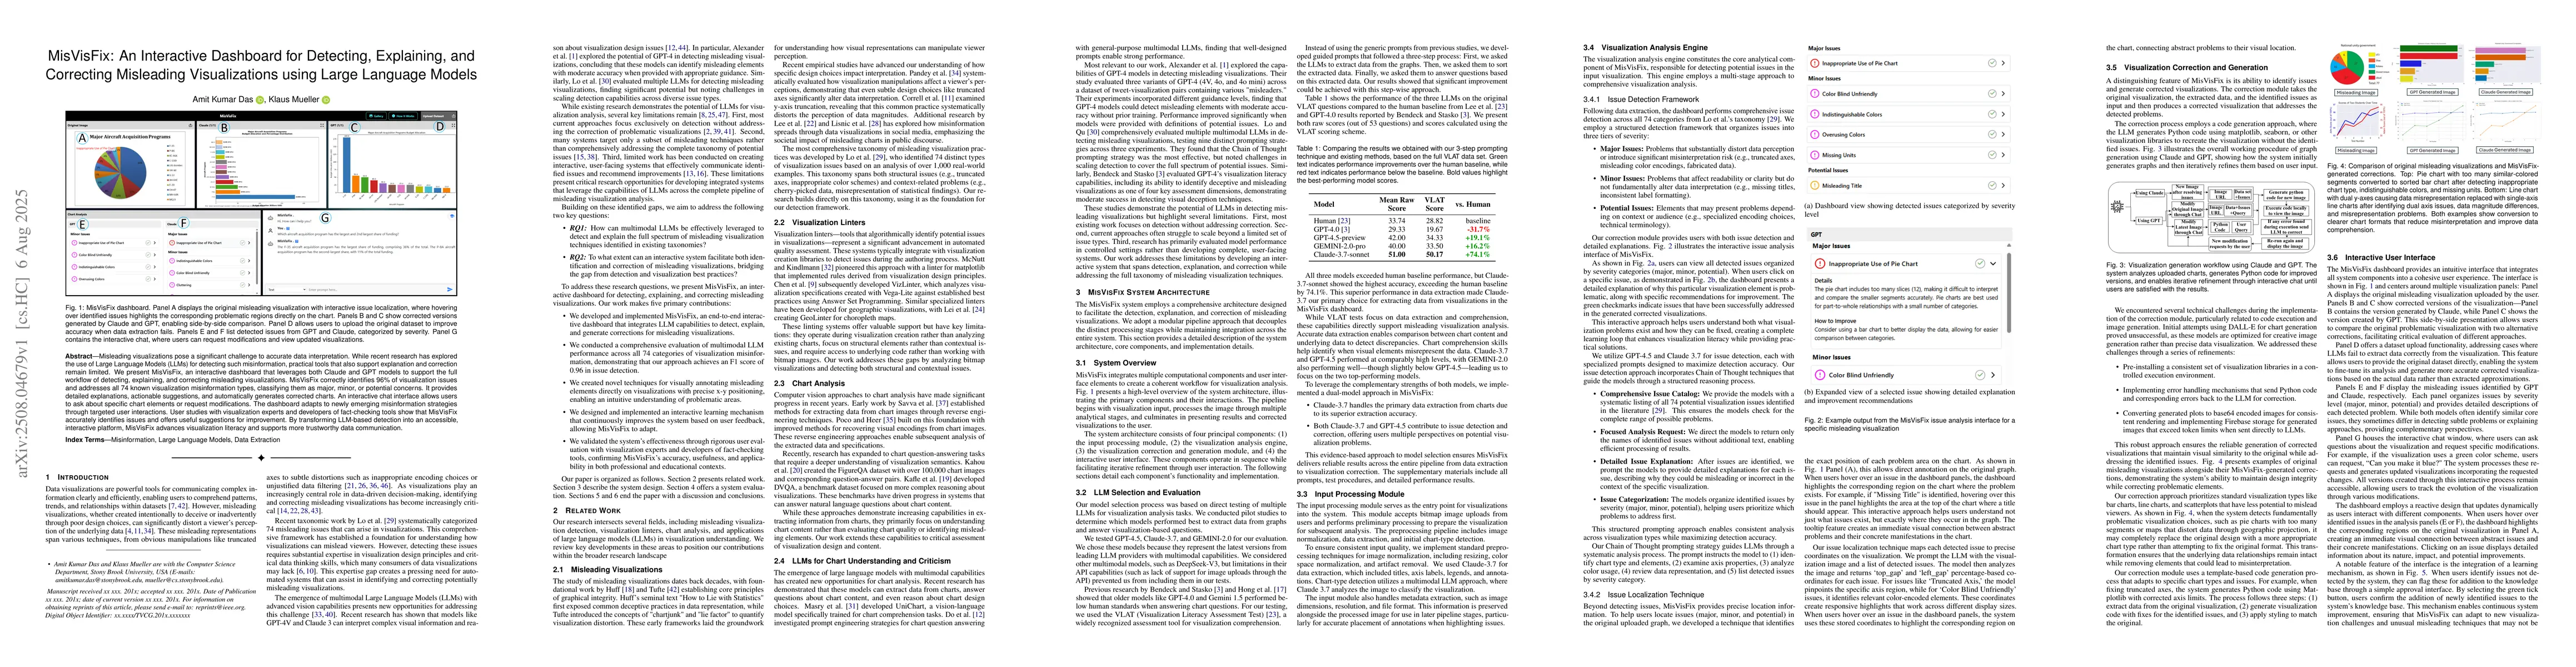
Misleading visualizations pose a significant challenge to accurate data interpretation. While recent research has explored the use of Large Language Models (LLMs) for detecting such misinformation, practical tools that also support explanation and correction remain limited. We present MisVisFix, an interactive dashboard that leverages both Claude and GPT models to support the full workflow of detecting, explaining, and correcting misleading visualizations. MisVisFix correctly identifies 96% of visualization issues and addresses all 74 known visualization misinformation types, classifying them as major, minor, or potential concerns. It provides detailed explanations, actionable suggestions, and automatically generates corrected charts. An interactive chat interface allows users to ask about specific chart elements or request modifications. The dashboard adapts to newly emerging misinformation strategies through targeted user interactions. User studies with visualization experts and developers of fact-checking tools show that MisVisFix accurately identifies issues and offers useful suggestions for improvement. By transforming LLM-based detection into an accessible, interactive platform, MisVisFix advances visualization literacy and supports more trustworthy data communication.
AI Key Findings
Get AI-generated insights about this paper's methodology, results, significance, and more — seven facets brought into focus.
Discussion 0