Publication
Metrics
Quick Actions
AI Quick Summary
This paper proposes a latent graphical model for analyzing mixed data with both continuous and categorical variables, including missing values, using a Gaussian latent structure. The model employs an Expectation-Maximization algorithm for fitting and sparse inverse covariance estimation to prevent overfitting, demonstrating superior performance in regression, classification, and imputation compared to state-of-the-art methods.
Paper Preview
Abstract
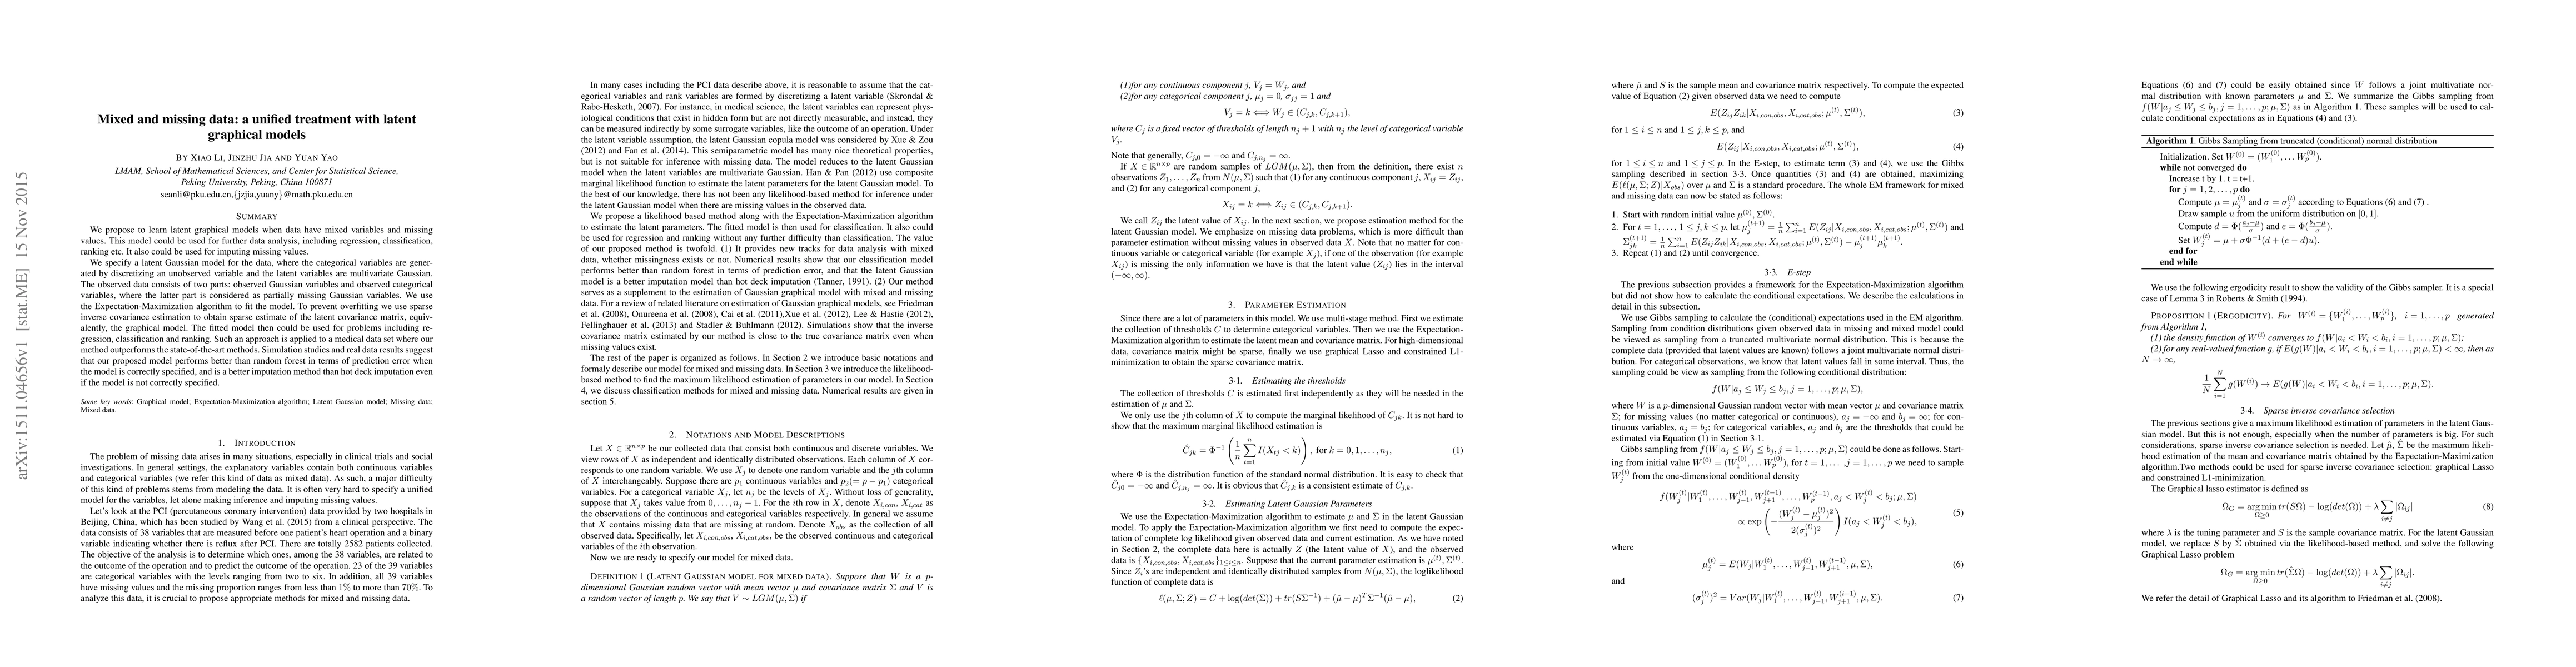
We propose to learn latent graphical models when data have mixed variables and missing values. This model could be used for further data analysis, including regression, classification, ranking etc. It also could be used for imputing missing values. We specify a latent Gaussian model for the data, where the categorical variables are generated by discretizing an unobserved variable and the latent variables are multivariate Gaussian. The observed data consists of two parts: observed Gaussian variables and observed categorical variables, where the latter part is considered as partially missing Gaussian variables. We use the Expectation-Maximization algorithm to fit the model. To prevent overfitting we use sparse inverse covariance estimation to obtain sparse estimate of the latent covariance matrix, equivalently, the graphical model. The fitted model then could be used for problems including re- gression, classification and ranking. Such an approach is applied to a medical data set where our method outperforms the state-of-the-art methods. Simulation studies and real data results suggest that our proposed model performs better than random forest in terms of prediction error when the model is correctly specified, and is a better imputation method than hot deck imputation even if the model is not correctly specified.
AI Key Findings
Get AI-generated insights about this paper's methodology, results, and significance.
Paper Details
How to Cite This Paper
@article{anon2015mixed,
  title         = {Mixed and missing data: a unified treatment with latent graphical models},
  year          = {2015},
  eprint        = {1511.04656},
  archivePrefix = {arXiv},
  primaryClass  = {stat.ME},
}(2015). Mixed and missing data: a unified treatment with latent graphical models. arXiv. https://arxiv.org/abs/1511.04656"Mixed and missing data: a unified treatment with latent graphical models." arXiv, 2015, arxiv.org/abs/1511.04656.PDF Preview
Key Terms
Citation Network
Current paper (gray), citations (green), references (blue)
Display is limited for performance on very large graphs.
Similar Papers
Found 4 papersMultivariate Generalised Linear Mixed Models With Graphical Latent Covariance Structure
Jeanett S. Pelck, Rodrigo Labouriau
Copula Graphical Models for Heterogeneous Mixed Data
Sjoerd Hermes, Joost van Heerwaarden, Pariya Behrouzi
No citations found for this paper.
Comments (0)