Model-based clustering of multivariate binary data with dimension reduction
Publication
Metrics
AI Quick Summary
This paper introduces a novel clustering method for multivariate binary data that combines dimension reduction with a finite mixture model of Bernoulli distributions. The method employs sparsity to enhance interpretability and stability, using an EM algorithm to solve the optimization problem, and is demonstrated through simulations and real-world data applications.
Paper Preview
Abstract
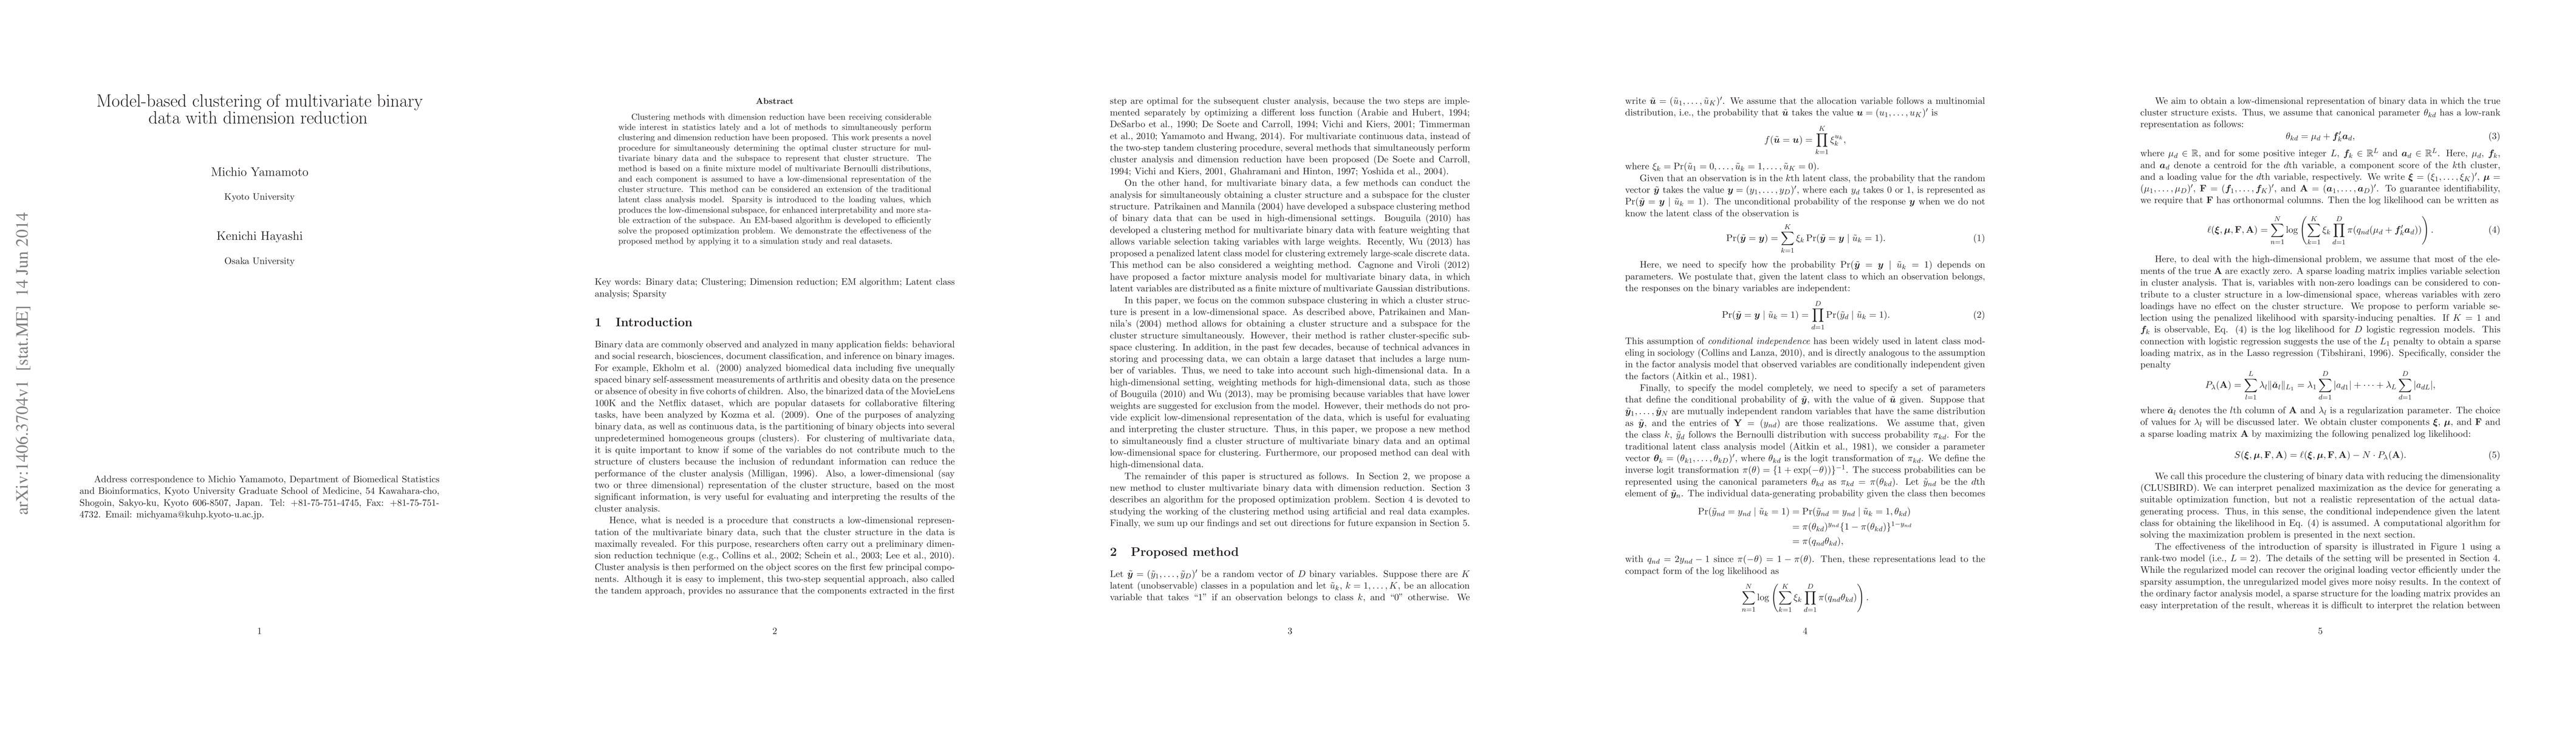
Clustering methods with dimension reduction have been receiving considerable wide interest in statistics lately and a lot of methods to simultaneously perform clustering and dimension reduction have been proposed. This work presents a novel procedure for simultaneously determining the optimal cluster structure for multivariate binary data and the subspace to represent that cluster structure. The method is based on a finite mixture model of multivariate Bernoulli distributions, and each component is assumed to have a low-dimensional representation of the cluster structure. This method can be considered an extension of the traditional latent class analysis model. Sparsity is introduced to the loading values, which produces the low-dimensional subspace, for enhanced interpretability and more stable extraction of the subspace. An EM-based algorithm is developed to efficiently solve the proposed optimization problem. We demonstrate the effectiveness of the proposed method by applying it to a simulation study and real datasets.
AI Key Findings
Get AI-generated insights about this paper's methodology, results, significance, and more — seven facets brought into focus.
Impact
Paper Details
PDF Preview
Key Terms
Citation Network
Current paper (gray), citations (green), references (blue)
Display is limited for performance on very large graphs.
Discussion 0