Model-Informed Machine Learning for Multi-component T2 Relaxometry
Publication
Metrics
AI Quick Summary
This paper proposes Model-Informed Machine Learning (MIML) to reconstruct T2 distributions from multi-echo MRI signals, combining machine learning with parametric and non-parametric approaches. MIML uses a multi-layer perceptron trained on synthetic data to provide accurate, noise-robust, and fast T2 distribution reconstructions, outperforming traditional methods in both synthetic and real-world data.
Paper Preview
Abstract
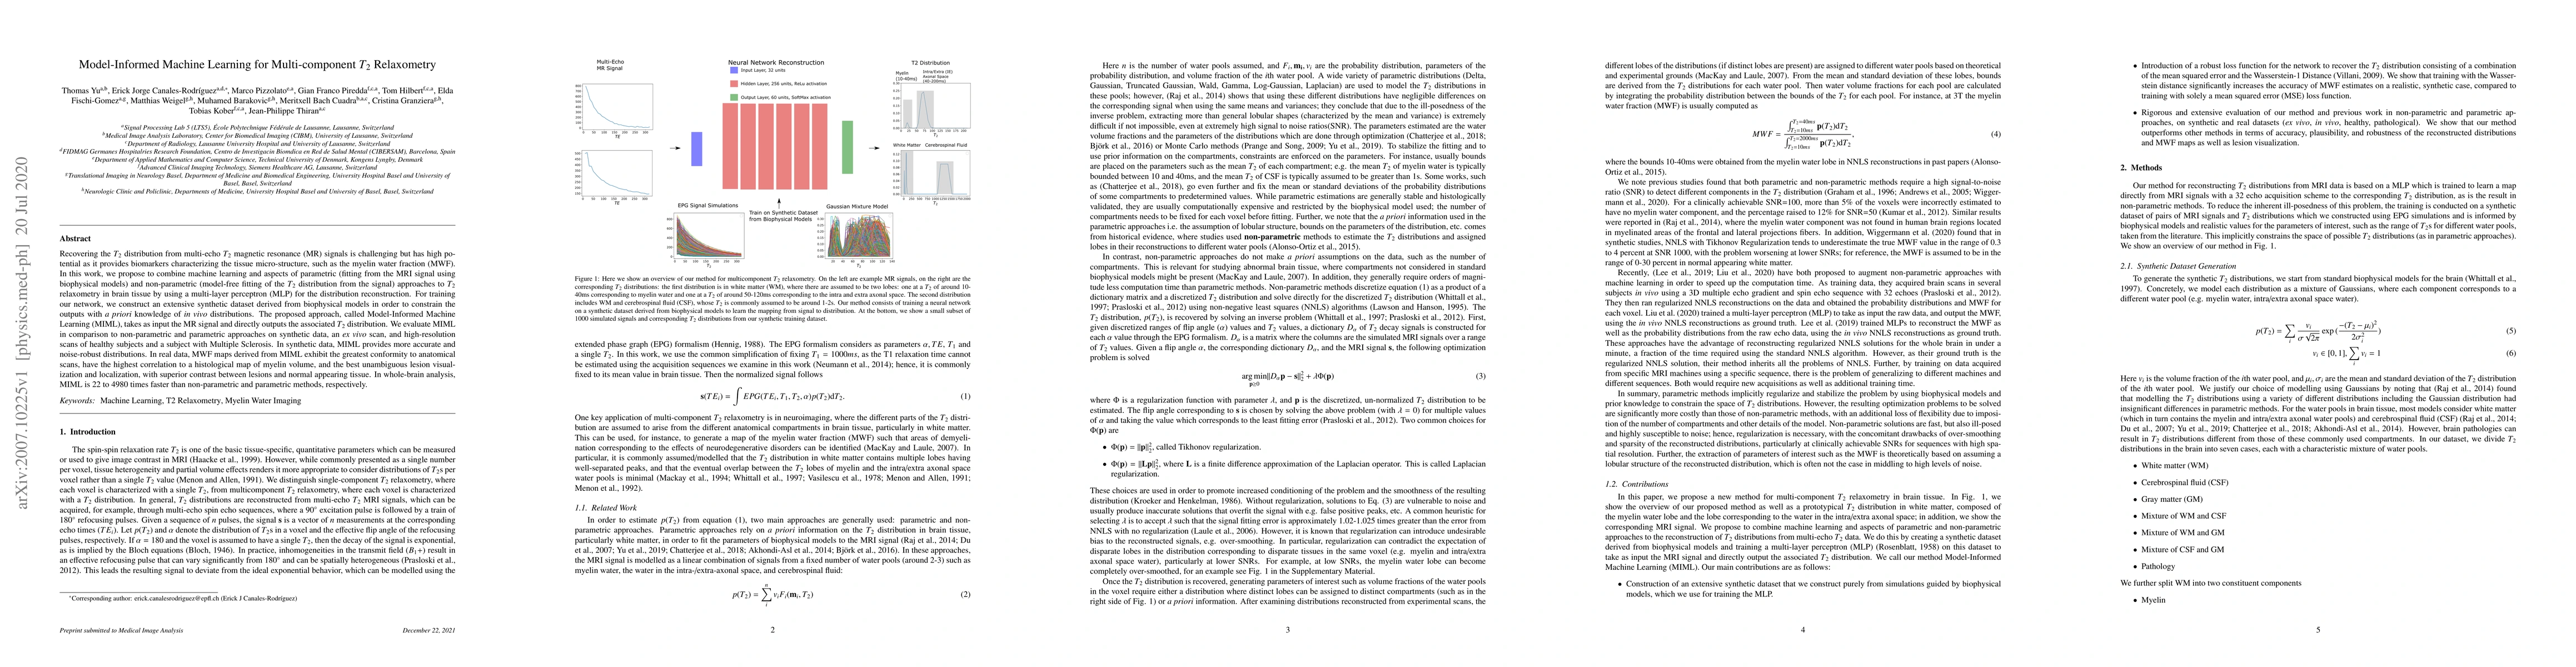
Recovering the T2 distribution from multi-echo T2 magnetic resonance (MR) signals is challenging but has high potential as it provides biomarkers characterizing the tissue micro-structure, such as the myelin water fraction (MWF). In this work, we propose to combine machine learning and aspects of parametric (fitting from the MRI signal using biophysical models) and non-parametric (model-free fitting of the T2 distribution from the signal) approaches to T2 relaxometry in brain tissue by using a multi-layer perceptron (MLP) for the distribution reconstruction. For training our network, we construct an extensive synthetic dataset derived from biophysical models in order to constrain the outputs with \textit{a priori} knowledge of \textit{in vivo} distributions. The proposed approach, called Model-Informed Machine Learning (MIML), takes as input the MR signal and directly outputs the associated T2 distribution. We evaluate MIML in comparison to non-parametric and parametric approaches on synthetic data, an ex vivo scan, and high-resolution scans of healthy subjects and a subject with Multiple Sclerosis. In synthetic data, MIML provides more accurate and noise-robust distributions. In real data, MWF maps derived from MIML exhibit the greatest conformity to anatomical scans, have the highest correlation to a histological map of myelin volume, and the best unambiguous lesion visualization and localization, with superior contrast between lesions and normal appearing tissue. In whole-brain analysis, MIML is 22 to 4980 times faster than non-parametric and parametric methods, respectively.
AI Key Findings
Get AI-generated insights about this paper's methodology, results, significance, and more — seven facets brought into focus.
Impact
Paper Details
Authors
PDF Preview
Key Terms
Citation Network
Current paper (gray), citations (green), references (blue)
Display is limited for performance on very large graphs.
Discussion 0