Modeling and Design Optimization of Looped Water Distribution Networks using MS Excel: Developing the Open-Source X-WHAT Model
Publication
Metrics
AI Quick Summary
This paper develops an MS Excel-based open-source tool, X-WHAT, for modeling and optimizing looped water distribution networks, employing Excel's solver for steady-state simulations without initial mass-conservative estimates. The tool's design considers cost factors and is presented as an accessible educational resource for engineering students.
Paper Preview
Abstract
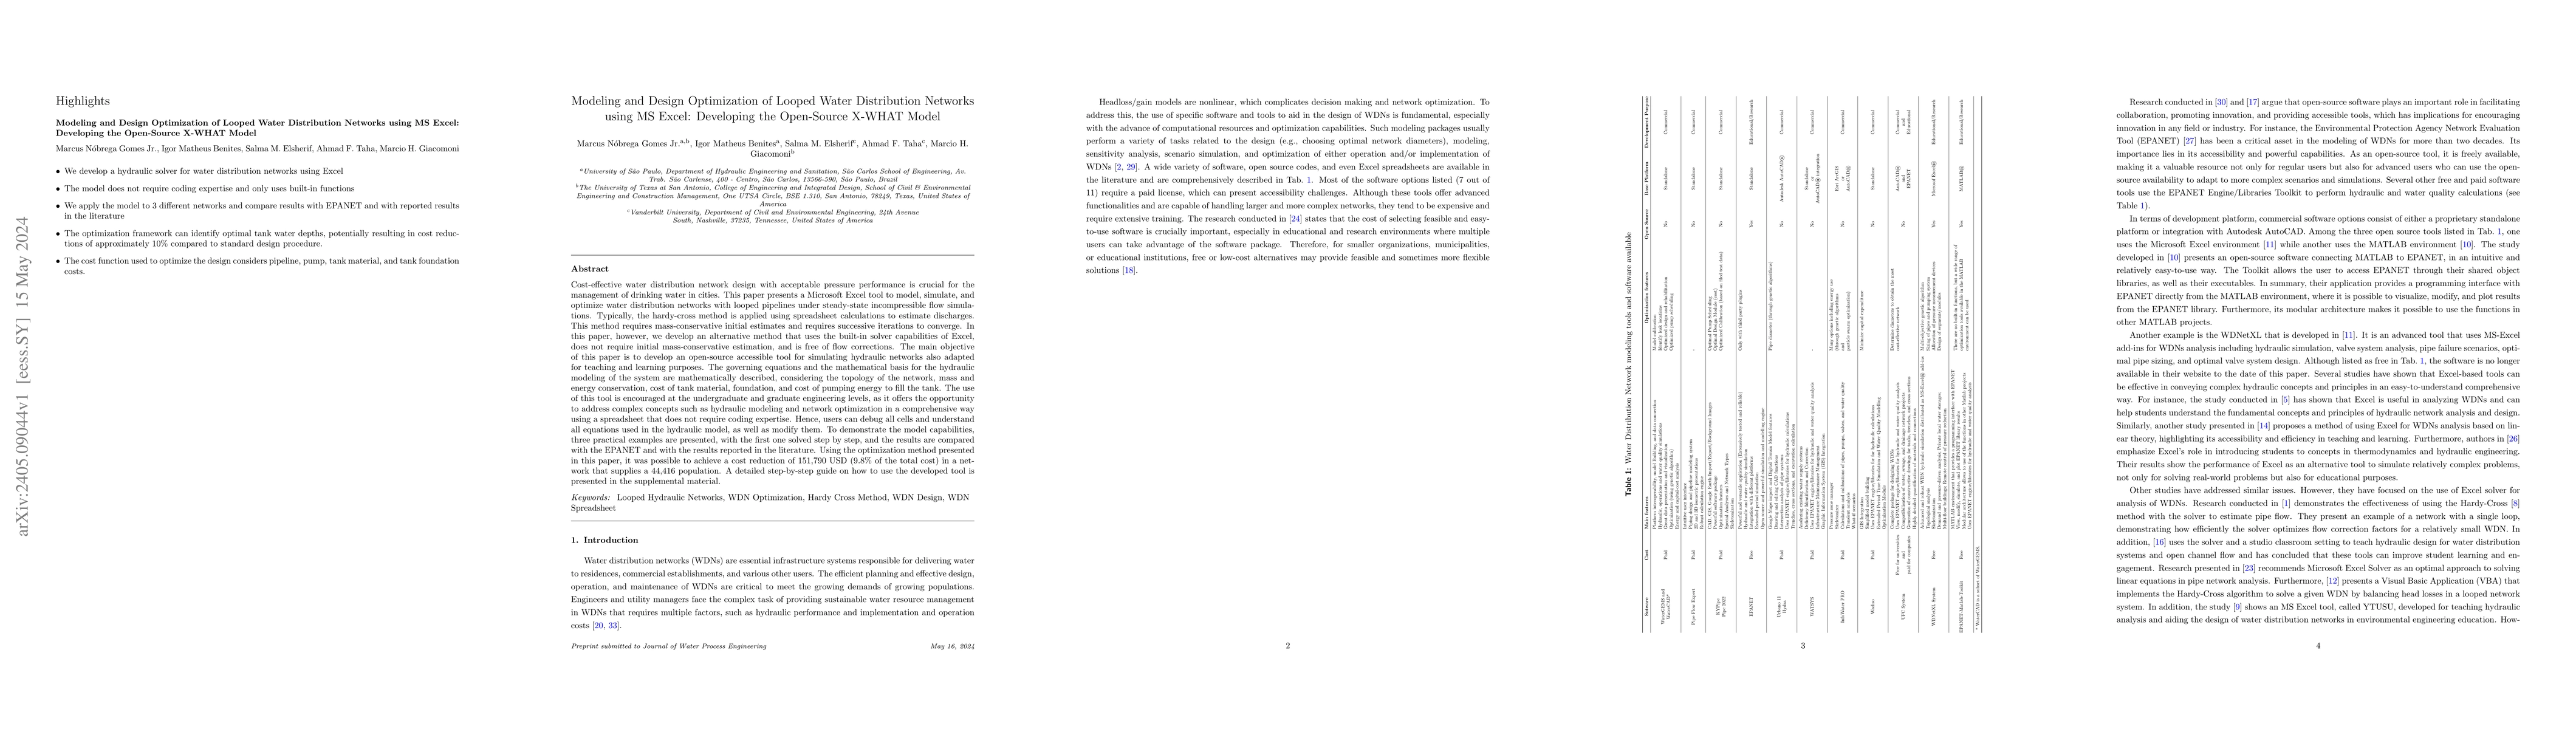
Cost-effective water distribution network (WDN) design with acceptable pressure performance is crucial for the management of drinking water in cities. This paper presents a Microsoft Excel tool to model, simulate, and optimize WDNs with looped pipelines under steady-state incompressible flow simulations. Typically, the hardy-cross method is applied using spreadsheet calculations to estimate discharges. This method requires mass-conservative initial estimates and requires successive iterations to converge. In this paper, however, we develop an alternative method that uses the built-in solver capabilities of Excel, does not require initial mass-conservative estimation, and is free of flow corrections. The main objective of this paper is to develop an open-source accessible tool for simulating hydraulic networks also adapted for teaching and learning purposes. The governing equations and the mathematical basis for the hydraulic modeling of the system are mathematically described, considering the topology of the network, mass and energy conservation, cost of tank material, foundation, and cost of pumping energy to fill the tank. The use of this tool is encouraged at the undergraduate and graduate engineering levels, as it offers the opportunity to address complex concepts in a comprehensive way using a spreadsheet that does not require coding expertise. Hence, users can debug all cells and understand all equations used in the hydraulic model, as well as modify them. To demonstrate the model capabilities, three practical examples are presented, with the first one solved step by step, and the results are compared with the EPANET and with the results reported in the literature. Using the optimization method presented in this paper, it was possible to achieve a cost reduction of 151,790 USD (9.8% of the total cost) in a network that supplies a 44,416 population.
AI Key Findings
Get AI-generated insights about this paper's methodology, results, significance, and more — seven facets brought into focus.
Impact
Paper Details
Authors
PDF Preview
Key Terms
Citation Network
Current paper (gray), citations (green), references (blue)
Display is limited for performance on very large graphs.
Discussion 0