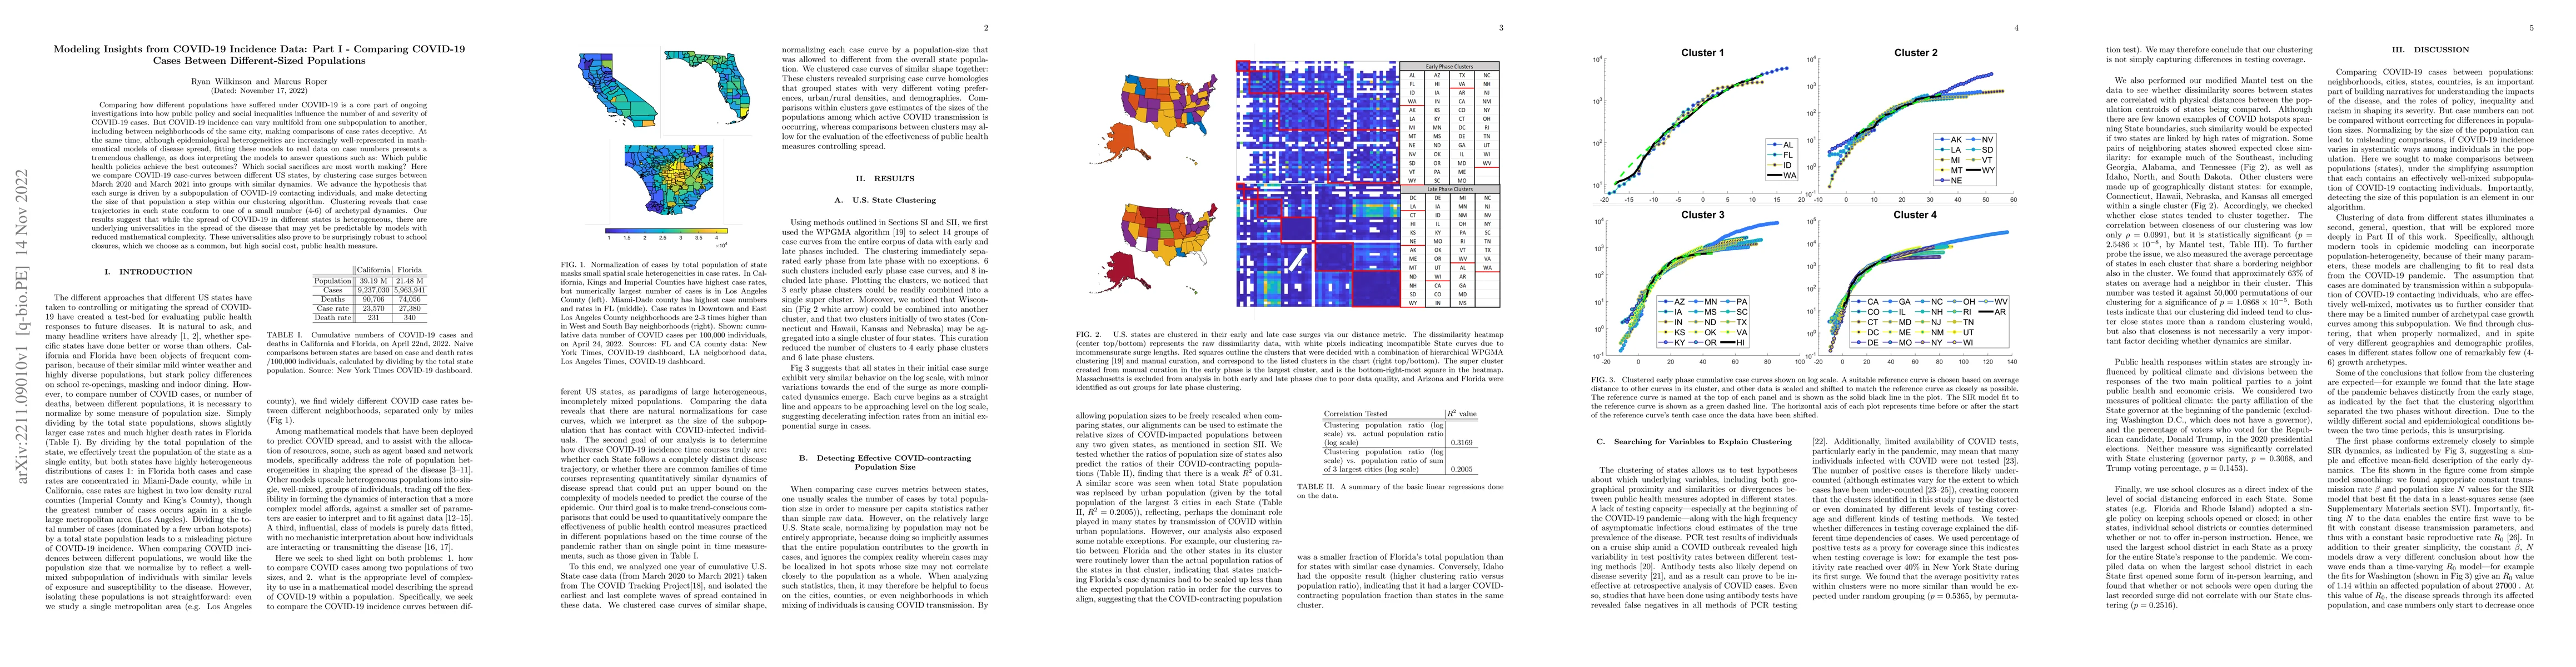
Modeling Insights from COVID-19 Incidence Data: Part I -- Comparing COVID-19 Cases Between Different-Sized Populations
Publication
Metrics
AI Quick Summary
This paper compares COVID-19 case dynamics across different US states, revealing that while incidence varies widely, case surges follow a small number of archetypal patterns. The study suggests underlying universalities in the spread of COVID-19 that may be captured by simplified models, despite the impact of high social cost measures like school closures.
Paper Preview
Abstract
Comparing how different populations have suffered under COVID-19 is a core part of ongoing investigations into how public policy and social inequalities influence the number of and severity of COVID-19 cases. But COVID-19 incidence can vary multifold from one subpopulation to another, including between neighborhoods of the same city, making comparisons of case rates deceptive. At the same time, although epidemiological heterogeneities are increasingly well-represented in mathematical models of disease spread, fitting these models to real data on case numbers presents a tremendous challenge, as does interpreting the models to answer questions such as: Which public health policies achieve the best outcomes? Which social sacrifices are most worth making? Here we compare COVID-19 case-curves between different US states, by clustering case surges between March 2020 and March 2021 into groups with similar dynamics. We advance the hypothesis that each surge is driven by a subpopulation of COVID-19 contacting individuals, and make detecting the size of that population a step within our clustering algorithm. Clustering reveals that case trajectories in each state conform to one of a small number (4-6) of archetypal dynamics. Our results suggest that while the spread of COVID-19 in different states is heterogeneous, there are underlying universalities in the spread of the disease that may yet be predictable by models with reduced mathematical complexity. These universalities also prove to be surprisingly robust to school closures, which we choose as a common, but high social cost, public health measure.
AI Key Findings
Get AI-generated insights about this paper's methodology, results, significance, and more — seven facets brought into focus.
Impact
Paper Details
Authors
PDF Preview
Key Terms
Citation Network
Current paper (gray), citations (green), references (blue)
Display is limited for performance on very large graphs.
Discussion 0