Modeling Oceanic Variables with Dynamic Graph Neural Networks
Publication
Metrics
AI Quick Summary
This paper proposes a dynamic graph neural network combining LSTM and Transformer models with Graph Neural Networks to predict oceanic variables like current velocity and sea surface height in the Santos-Sao Vicente-Bertioga Estuarine System. The model outperforms the Santos Operational Forecasting System by leveraging temporal and spatial relationships among observation sites.
Paper Preview
Abstract
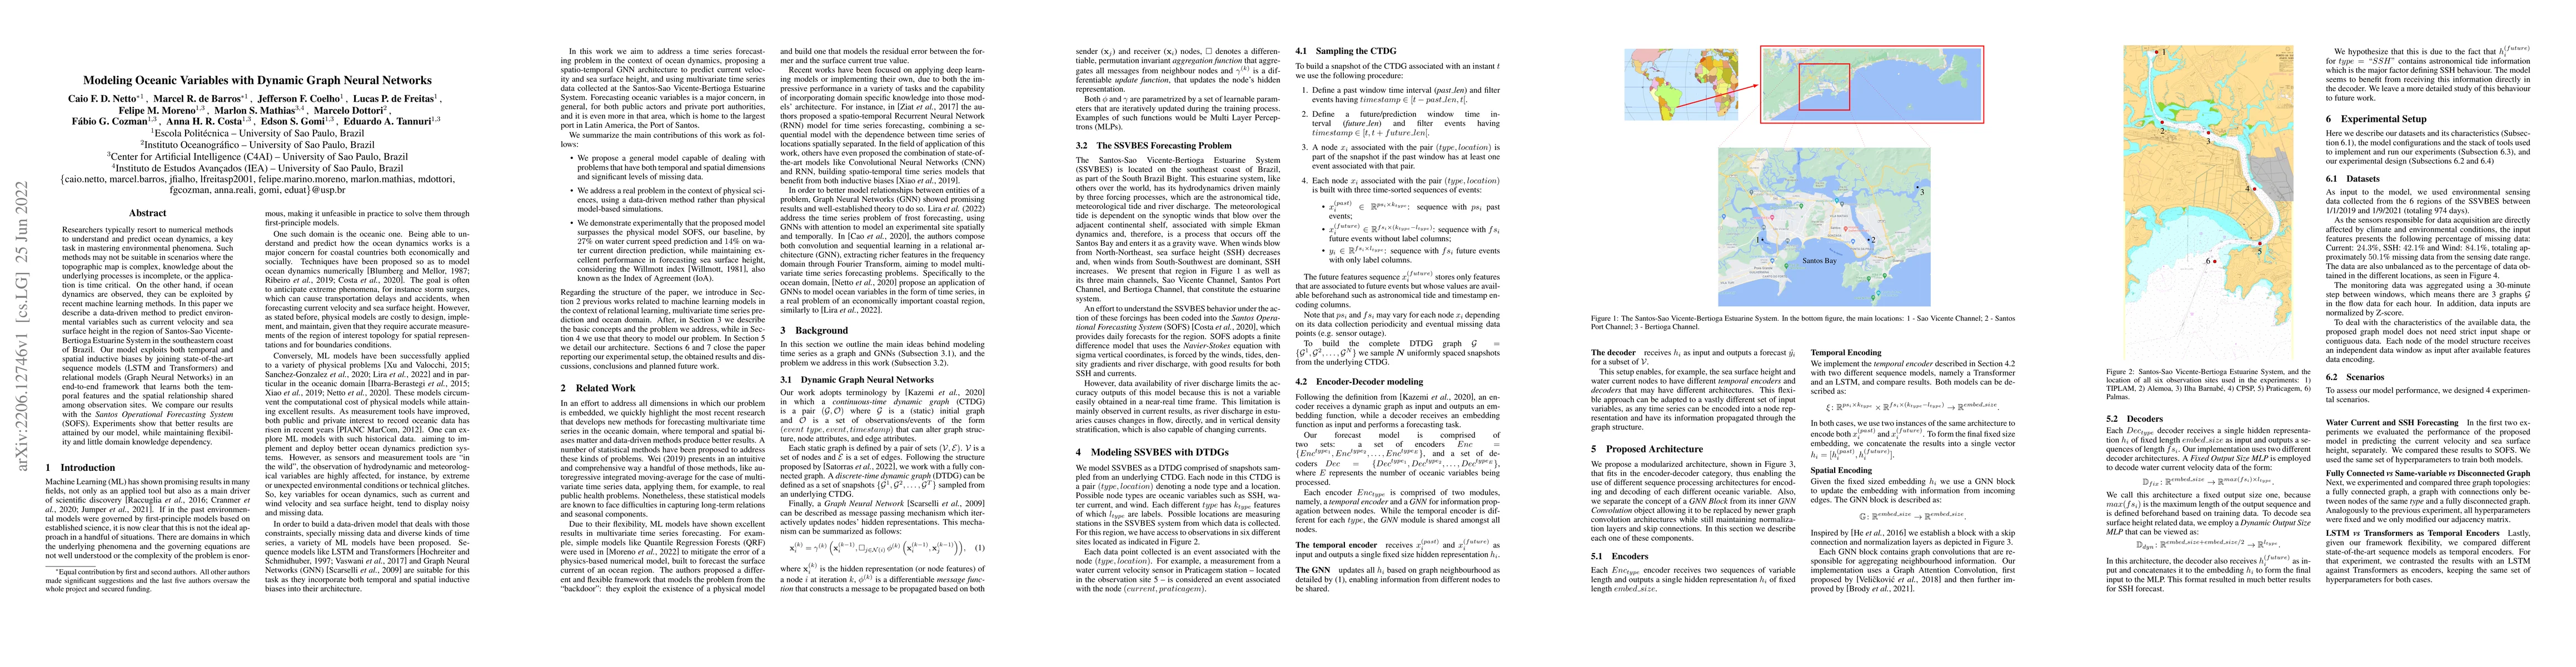
Researchers typically resort to numerical methods to understand and predict ocean dynamics, a key task in mastering environmental phenomena. Such methods may not be suitable in scenarios where the topographic map is complex, knowledge about the underlying processes is incomplete, or the application is time critical. On the other hand, if ocean dynamics are observed, they can be exploited by recent machine learning methods. In this paper we describe a data-driven method to predict environmental variables such as current velocity and sea surface height in the region of Santos-Sao Vicente-Bertioga Estuarine System in the southeastern coast of Brazil. Our model exploits both temporal and spatial inductive biases by joining state-of-the-art sequence models (LSTM and Transformers) and relational models (Graph Neural Networks) in an end-to-end framework that learns both the temporal features and the spatial relationship shared among observation sites. We compare our results with the Santos Operational Forecasting System (SOFS). Experiments show that better results are attained by our model, while maintaining flexibility and little domain knowledge dependency.
AI Key Findings
Get AI-generated insights about this paper's methodology, results, significance, and more — seven facets brought into focus.
Impact
Paper Details
Authors
PDF Preview
Key Terms
Citation Network
Current paper (gray), citations (green), references (blue)
Display is limited for performance on very large graphs.
Discussion 0