Summary
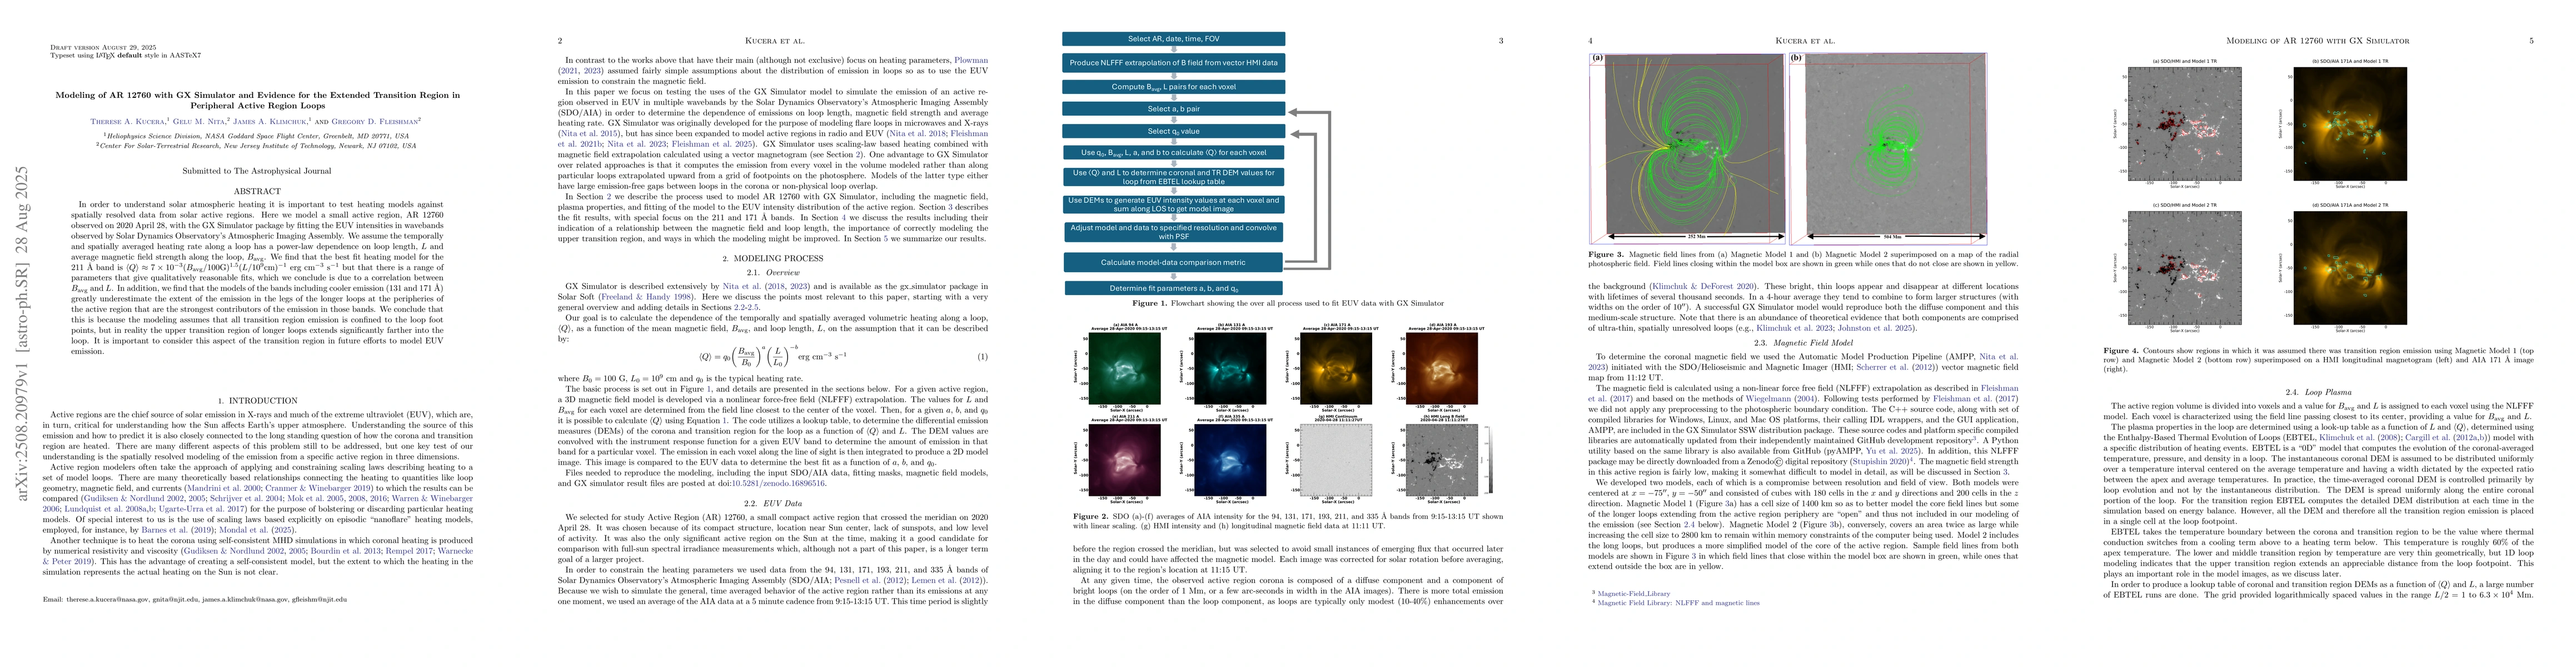
In order to understand solar atmospheric heating it is important to test heating models against spatially resolved data from solar active regions. Here we model a small active region, AR~12760 observed on 2020 April 28, with the GX Simulator package by fitting the EUV intensities in wavebands observed by Solar Dynamics Observatory's Atmospheric Imaging Assembly. We assume the temporally and spatially averaged heating rate along a loop has a power-law dependence on loop length, $L$ and average magnetic field strength along the loop, $B_{avg}$. We find that the best fit heating model for the 211~\AA\ band is $<\!\!Q\!\!>\approx 7\times 10^{-3} (B_{avg}/{100 \mbox{G}})^{1.5}(L/{10^9\mbox{cm}})^{-1}$ erg cm$^{-3}$ s$^{-1}$ but that there is a range of parameters that give qualitatively reasonable fits, which we conclude is due to a correlation between $B_{avg}$ and $L$. In addition, we find that the models of the bands including cooler emission (131 and 171~\AA) greatly underestimate the extent of the emission in the legs of the longer loops at the peripheries of the active region that are the strongest contributors of the emission in those bands. We conclude that this is because the modeling assumes that all transition region emission is confined to the loop foot points, but in reality the upper transition region of longer loops extends significantly farther into the loop. It is important to consider this aspect of the transition region in future efforts to model EUV emission.
AI Key Findings
Get AI-generated insights about this paper's methodology, results, and significance.
Paper Details
PDF Preview
Similar Papers
Found 4 papersData-Constrained Solar Modeling with GX Simulator
Dale E. Gary, Gregory D. Fleishman, Gelu M. Nita et al.
Modeling Realistic Heating Profiles of Transition Region Hot Loops on the Sun: Evidence for Impulsive Heating and Non-equilibrium Ionization
Shah Mohammad Bahauddin, Stephen J Bradshaw
Comments (0)