Publication
Metrics
AI Quick Summary
This paper proposes a novel method to model regime shifts in co-evolving time series by utilizing a mapping grid to summarize interactions between series. It addresses shortcomings in existing methods by incorporating time-dependent behaviors and handling data discontinuities through a dynamic network and a time-dependent Cox regression model.
Paper Preview
Abstract
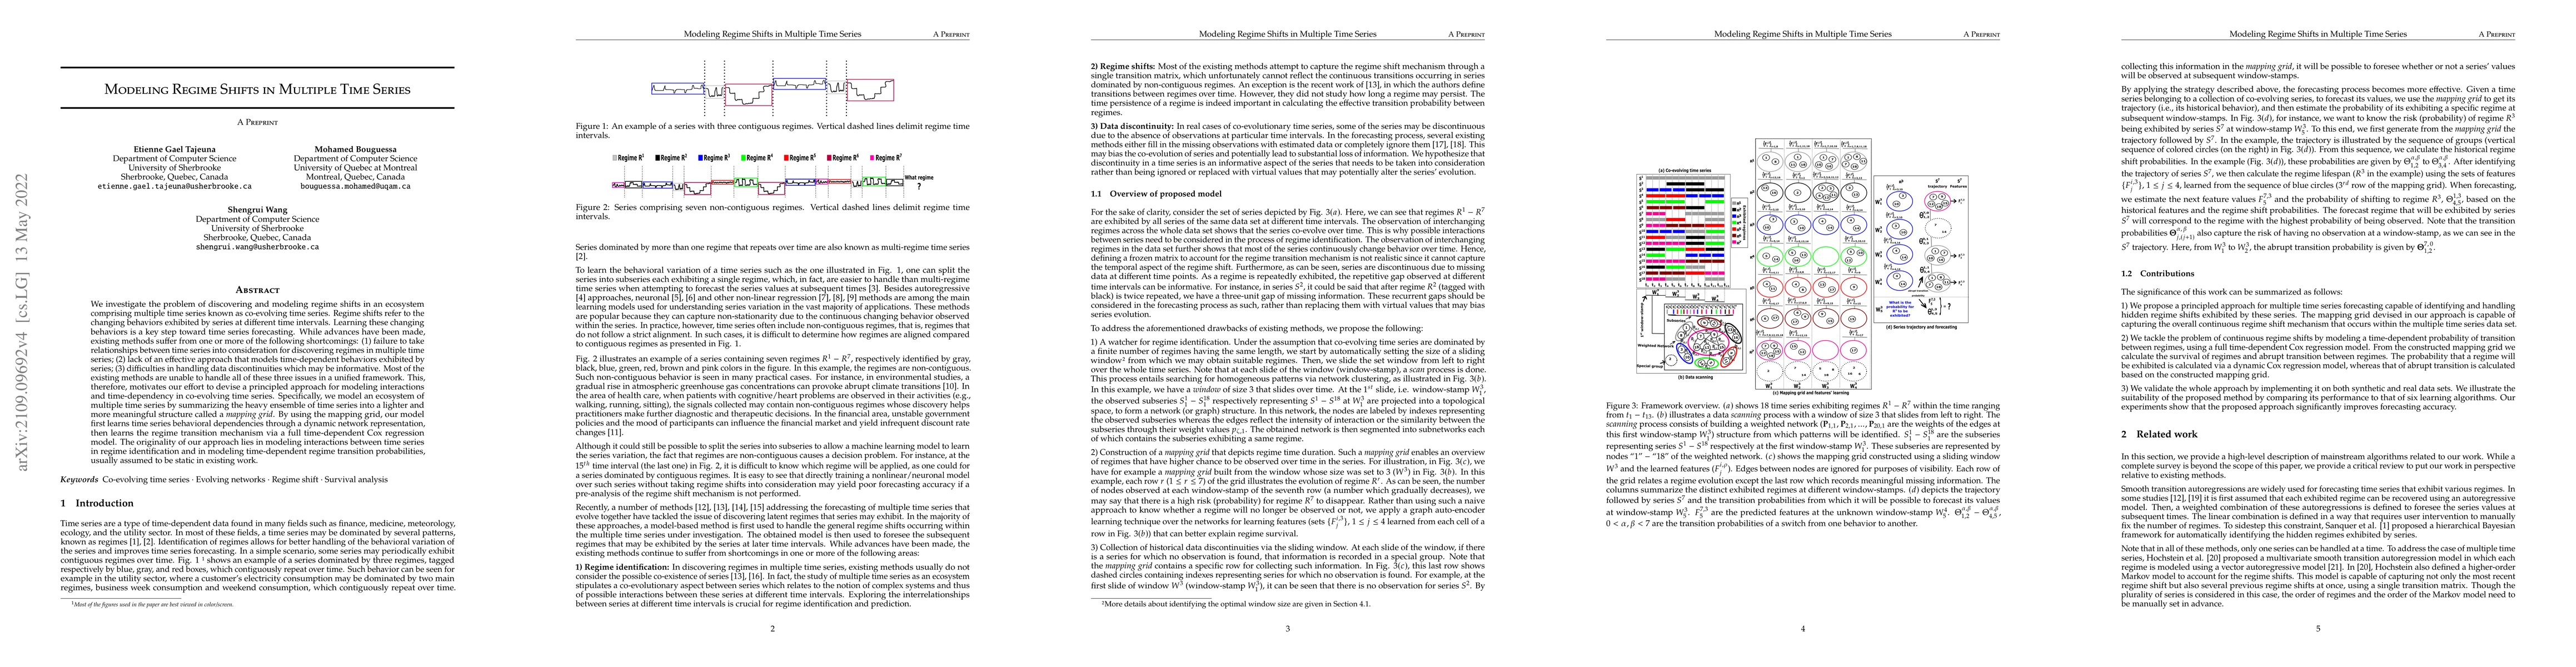
We investigate the problem of discovering and modeling regime shifts in an ecosystem comprising multiple time series known as co-evolving time series. Regime shifts refer to the changing behaviors exhibited by series at different time intervals. Learning these changing behaviors is a key step toward time series forecasting. While advances have been made, existing methods suffer from one or more of the following shortcomings: (1) failure to take relationships between time series into consideration for discovering regimes in multiple time series; (2) lack of an effective approach that models time-dependent behaviors exhibited by series; (3) difficulties in handling data discontinuities which may be informative. Most of the existing methods are unable to handle all of these three issues in a unified framework. This, therefore, motivates our effort to devise a principled approach for modeling interactions and time-dependency in co-evolving time series. Specifically, we model an ecosystem of multiple time series by summarizing the heavy ensemble of time series into a lighter and more meaningful structure called a \textit{mapping grid}. By using the mapping grid, our model first learns time series behavioral dependencies through a dynamic network representation, then learns the regime transition mechanism via a full time-dependent Cox regression model. The originality of our approach lies in modeling interactions between time series in regime identification and in modeling time-dependent regime transition probabilities, usually assumed to be static in existing work.
AI Key Findings
Get AI-generated insights about this paper's methodology, results, significance, and more — seven facets brought into focus.
Impact
Paper Details
Authors
PDF Preview
Key Terms
Citation Network
Current paper (gray), citations (green), references (blue)
Display is limited for performance on very large graphs.
Discussion 0