Summary
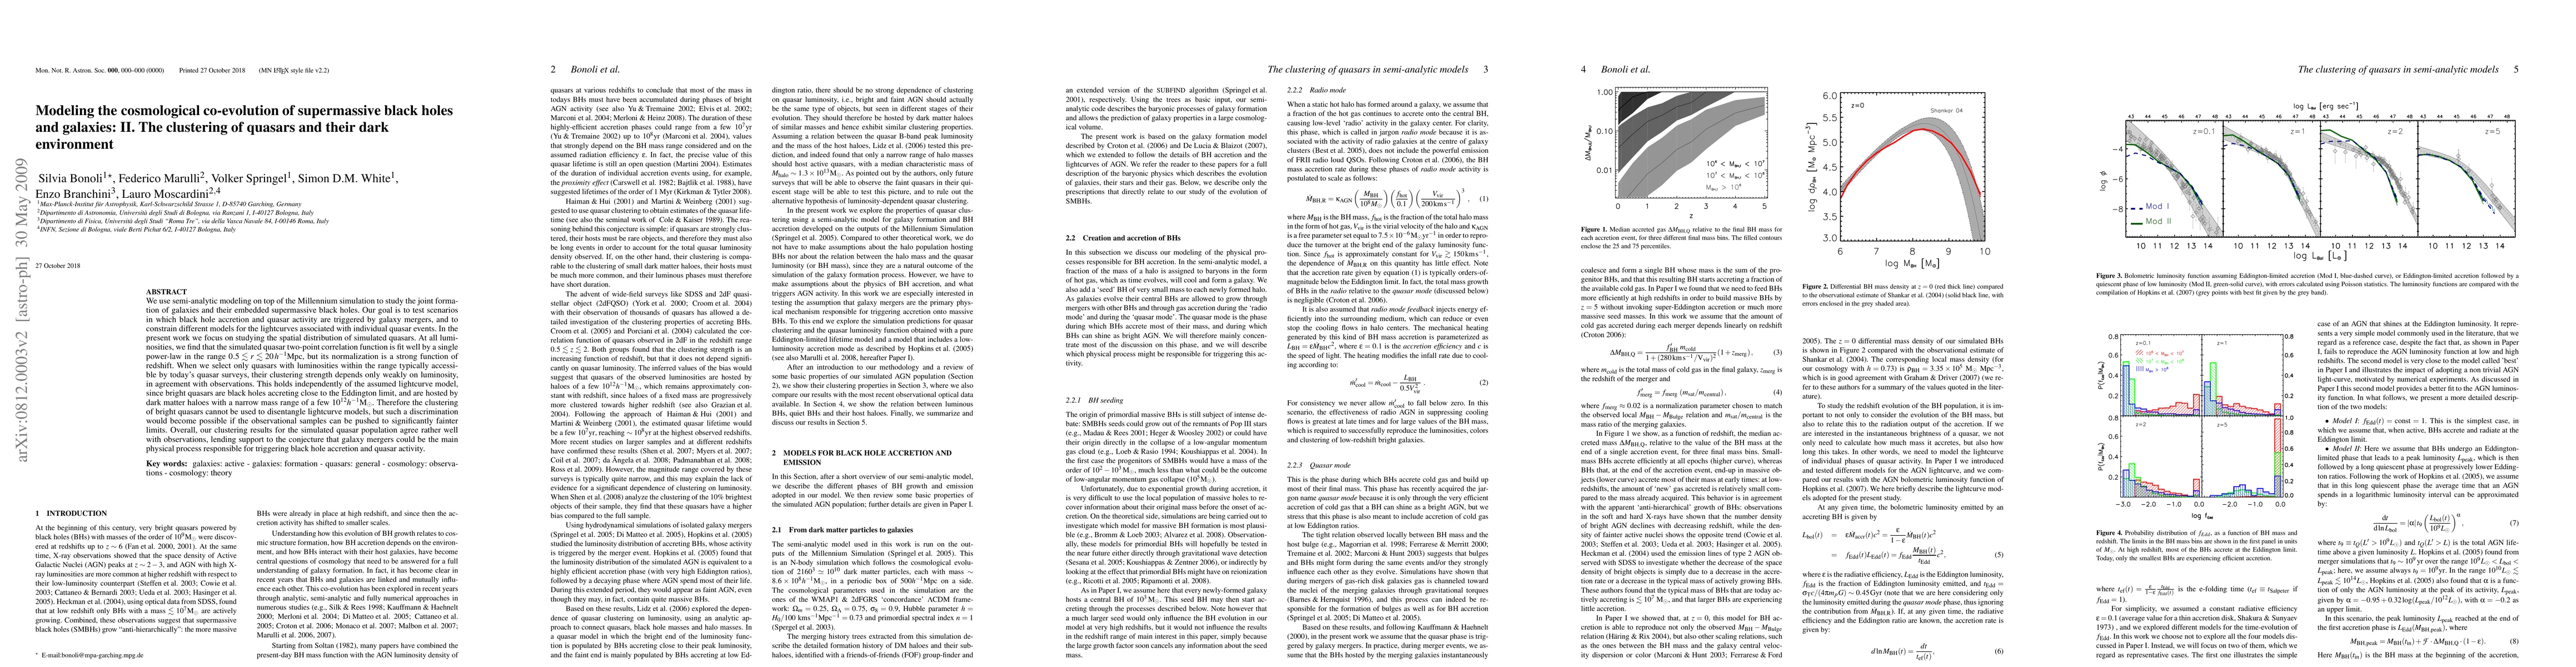
We use semi-analytic modeling on top of the Millennium simulation to study the joint formation of galaxies and their embedded supermassive black holes. Our goal is to test scenarios in which black hole accretion and quasar activity are triggered by galaxy mergers, and to constrain different models for the lightcurves associated with individual quasar events. In the present work we focus on studying the spatial distribution of simulated quasars. At all luminosities, we find that the simulated quasar two-point correlation function is fit well by a single power-law in the range 0.5 < r < 20 h^{-1} Mpc, but its normalization is a strong function of redshift. When we select only quasars with luminosities within the range typically accessible by today's quasar surveys, their clustering strength depends only weakly on luminosity, in agreement with observations. This holds independently of the assumed lightcurve model, since bright quasars are black holes accreting close to the Eddington limit, and are hosted by dark matter haloes with a narrow mass range of a few 10^12 h^{-1} M_sun. Therefore the clustering of bright quasars cannot be used to disentangle lightcurve models, but such a discrimination would become possible if the observational samples can be pushed to significantly fainter limits. Overall, our clustering results for the simulated quasar population agree rather well with observations, lending support to the conjecture that galaxy mergers could be the main physical process responsible for triggering black hole accretion and quasar activity.
AI Key Findings
Get AI-generated insights about this paper's methodology, results, and significance.
Paper Details
PDF Preview
Key Terms
Citation Network
Current paper (gray), citations (green), references (blue)
Display is limited for performance on very large graphs.
Similar Papers
Found 4 papers| Title | Authors | Year | Actions |
|---|
Comments (0)