Summary
The evolution of Gini coefficient for personal incomes in the USA between 1947 and 2005 is analyzed and modeled. There are several versions of personal income distribution (PID) provided by the US Census Bureau (US CB) for this period with various levels of resolution. Effectively, these PIDs result in different Gini coefficients due to the differences between discrete and continuous representations. When all persons of 15 years of age and over are included in the PIDs, Gini coefficient drops from 0.64 in 1947 to 0.54 in 1990. This effect is observed due to a significant decrease in the portion of people without income. For the PIDs not including persons without income, Gini coefficient is varying around 0.51 between 1960 and 2005 with standard deviation of 0.004, i.e. is in fact constant. This Gini coefficient is practically independent on the portion of population included in the PIDs according to any revision of income definitions. The driving force of the model describing the evolution of individual incomes (microeconomic level) and their aggregate value (macroeconomic level) is the change in nominal GDP per capita. The model accurately predicts the evolution of Gini coefficient for the PIDs for people with income. The model gives practically unchanged (normalized) PIDs and Gini coefficient between 1947 and 2005. The empirical Gini curves converge to the predicted one when the number of people without income decreases. Asymptotically, the empirical curves should collapse to the theoretical one when all the working age population obtains an appropriate definition of income. Therefore the model Gini coefficient potentially better describes true behavior of inequality in the USA because the definitions of income used by the US Census Bureau apparently fail to describe true income distribution.
AI Key Findings
Get AI-generated insights about this paper's methodology, results, and significance.
Paper Details
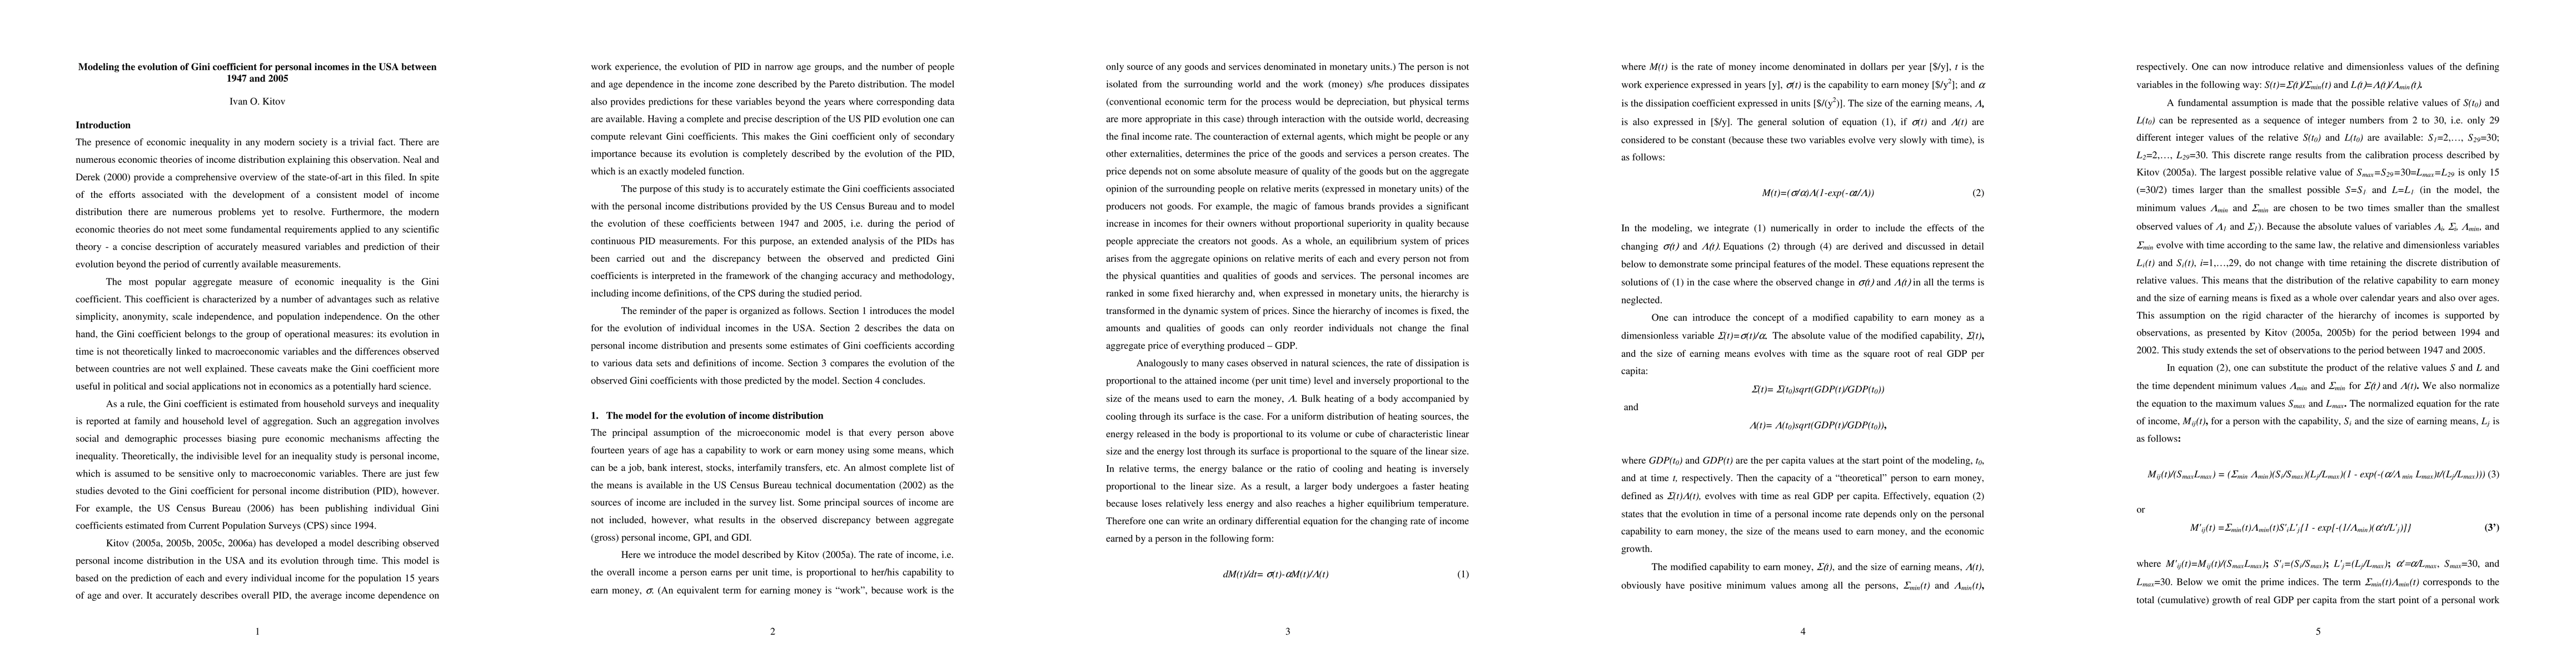
PDF Preview
Key Terms
Citation Network
Current paper (gray), citations (green), references (blue)
Display is limited for performance on very large graphs.
Similar Papers
Found 4 papersEvidence for the exponential distribution of income in the USA
Victor M. Yakovenko, Adrian Dragulescu
| Title | Authors | Year | Actions |
|---|
Comments (0)