Publication
Metrics
AI Quick Summary
This paper proposes a "spatio-temporal Gravity model" within a generalised linear model framework to assess the endemic spread of COVID-19 in India, using air-traffic passenger count as a proxy for local mobility. The model outperforms existing models in predicting COVID-19 trends in India.
Paper Preview
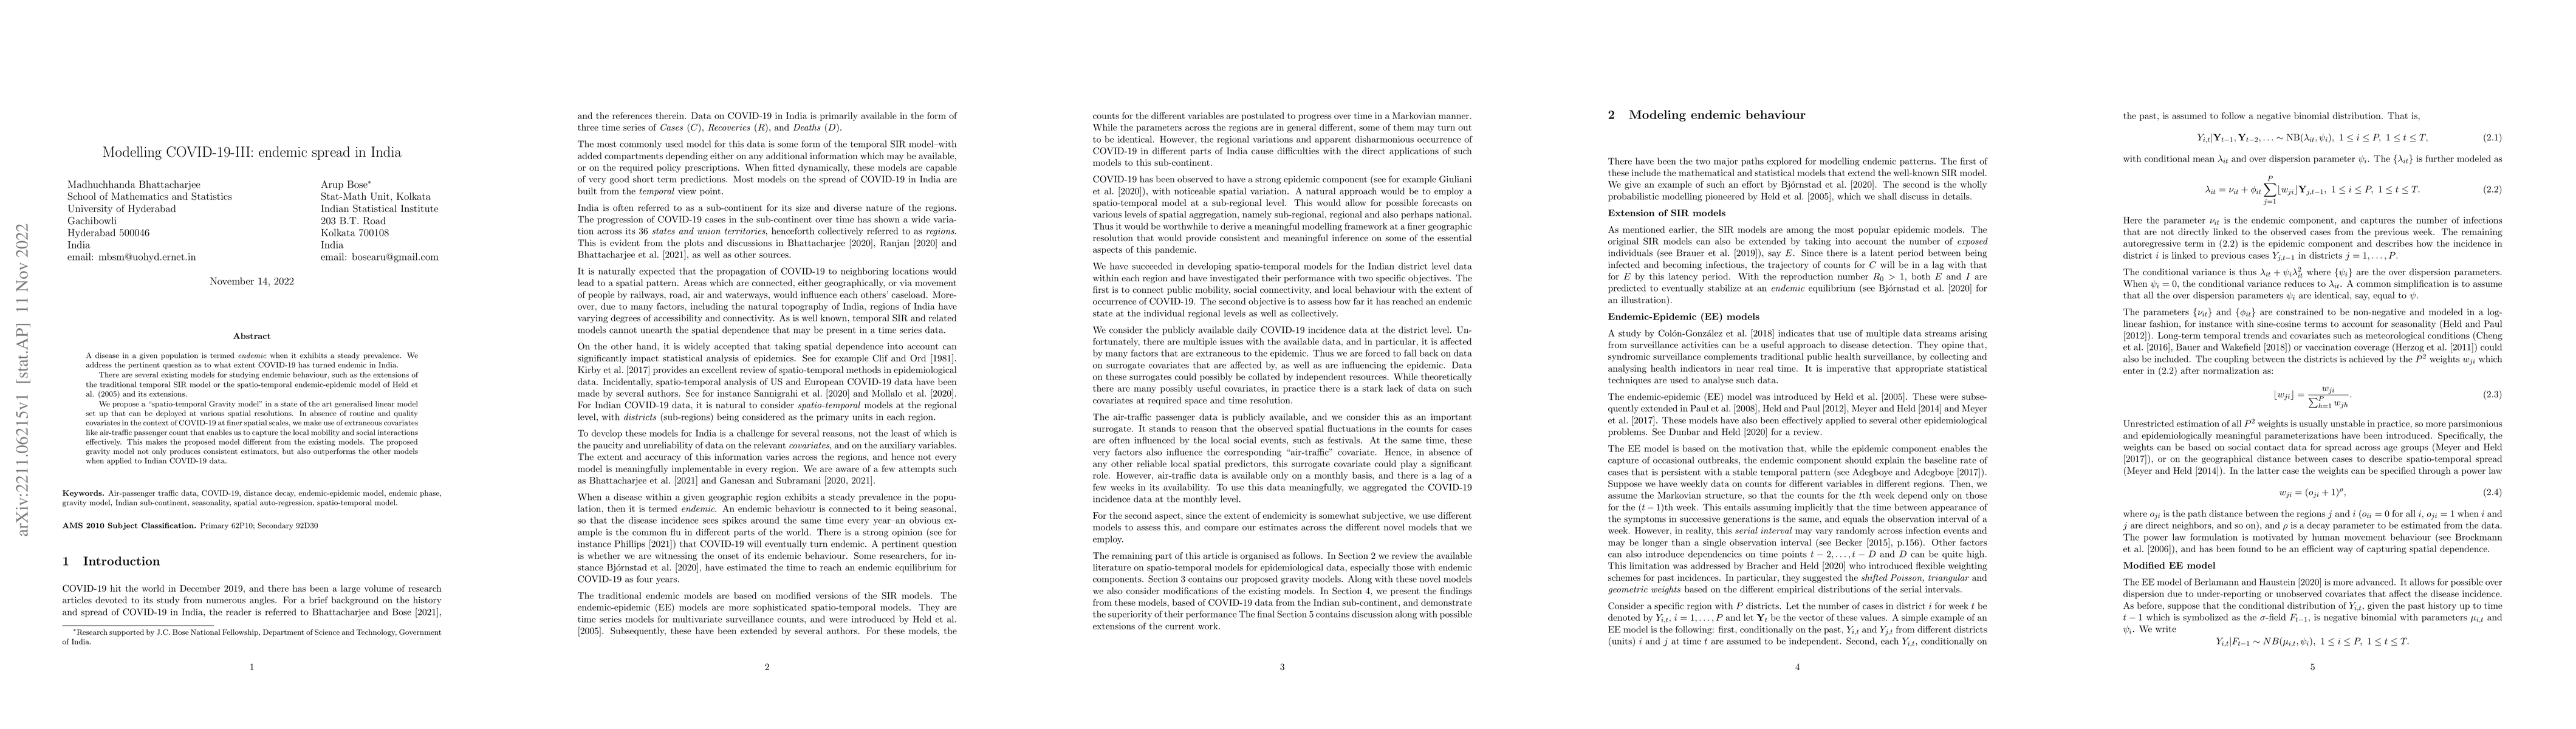
Abstract
A disease in a given population is termed endemic when it exhibits a steady prevalence. We address the pertinent question as to what extent COVID-19 has turned endemic in India. There are several existing models for studying endemic behaviour, such as the extensions of the traditional temporal SIR model or the spatio-temporal endemic-epidemic model of Held et al. (2005) and its extensions. We propose a "spatio-temporal Gravity model" in a state of the art generalised linear model set up that can be deployed at various spatial resolutions. In absence of routine and quality covariates in the context of COVID-19 at finer spatial scales, we make use of extraneous covariates like air-traffic passenger count that enables us to capture the local mobility and social interactions effectively. This makes the proposed model different from the existing models. The proposed gravity model not only produces consistent estimators, but also outperforms the other models when applied to Indian COVID-19 data.
AI Key Findings
Get AI-generated insights about this paper's methodology, results, significance, and more — seven facets brought into focus.
Impact
Paper Details
Authors
PDF Preview
Key Terms
Citation Network
Current paper (gray), citations (green), references (blue)
Display is limited for performance on very large graphs.
Discussion 0