Modelling financial volume curves with hierarchical Poisson processes
Publication
Metrics
AI Quick Summary
This paper introduces a hierarchical Poisson process model to predict financial trading volume curves throughout the day, using a Markov Chain Monte Carlo algorithm based on slice sampling. The model effectively groups and predicts trading volumes across different stocks and industries.
Paper Preview
Abstract
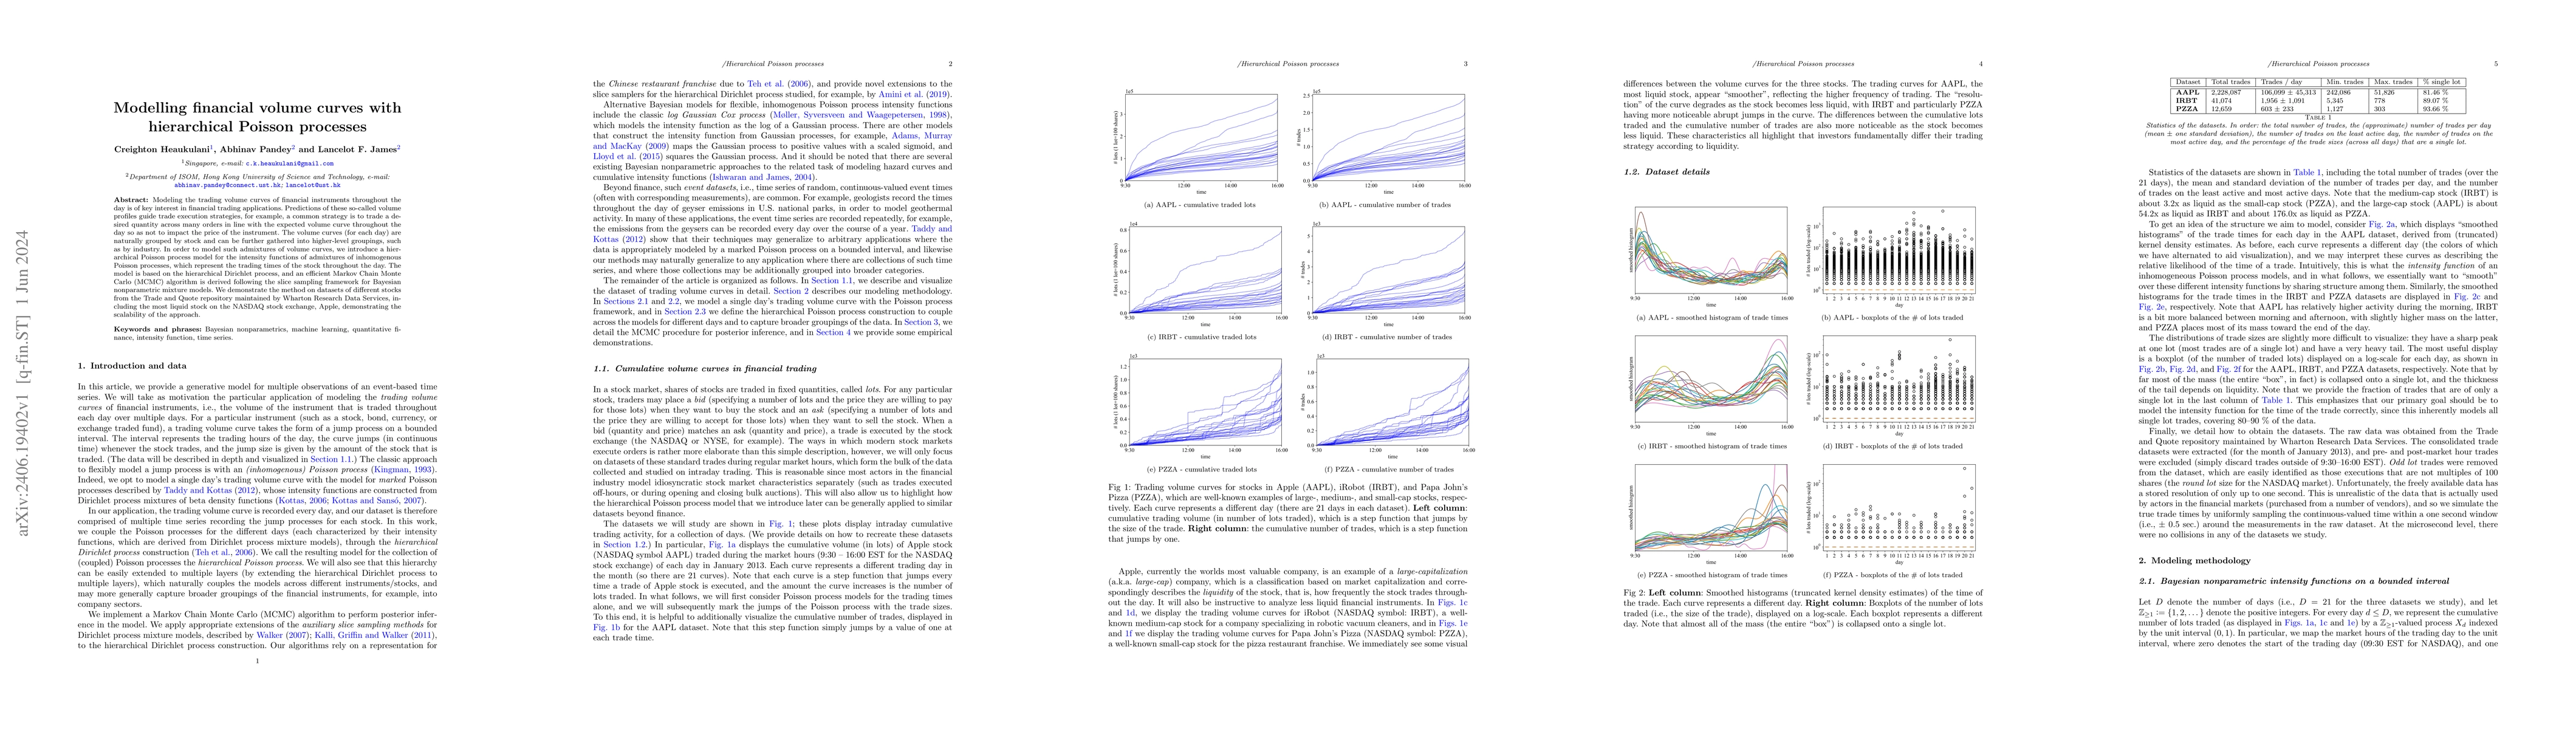
Modeling the trading volume curves of financial instruments throughout the day is of key interest in financial trading applications. Predictions of these so-called volume profiles guide trade execution strategies, for example, a common strategy is to trade a desired quantity across many orders in line with the expected volume curve throughout the day so as not to impact the price of the instrument. The volume curves (for each day) are naturally grouped by stock and can be further gathered into higher-level groupings, such as by industry. In order to model such admixtures of volume curves, we introduce a hierarchical Poisson process model for the intensity functions of admixtures of inhomogenous Poisson processes, which represent the trading times of the stock throughout the day. The model is based on the hierarchical Dirichlet process, and an efficient Markov Chain Monte Carlo (MCMC) algorithm is derived following the slice sampling framework for Bayesian nonparametric mixture models. We demonstrate the method on datasets of different stocks from the Trade and Quote repository maintained by Wharton Research Data Services, including the most liquid stock on the NASDAQ stock exchange, Apple, demonstrating the scalability of the approach.
AI Key Findings
Get AI-generated insights about this paper's methodology, results, significance, and more — seven facets brought into focus.
Impact
Paper Details
Authors
PDF Preview
Key Terms
Citation Network
Current paper (gray), citations (green), references (blue)
Display is limited for performance on very large graphs.
Discussion 0