Modelling real GDP per capita in the USA: cointegration test
Publication
Metrics
AI Quick Summary
This paper presents a two-component model for real GDP per capita in the USA, showing a cointegrating relationship between GDP growth and the number of 9-year-olds. Cointegration tests confirm a strong link, with the highest R² and lowest RMSE in the VAR model.
Paper Preview
Abstract
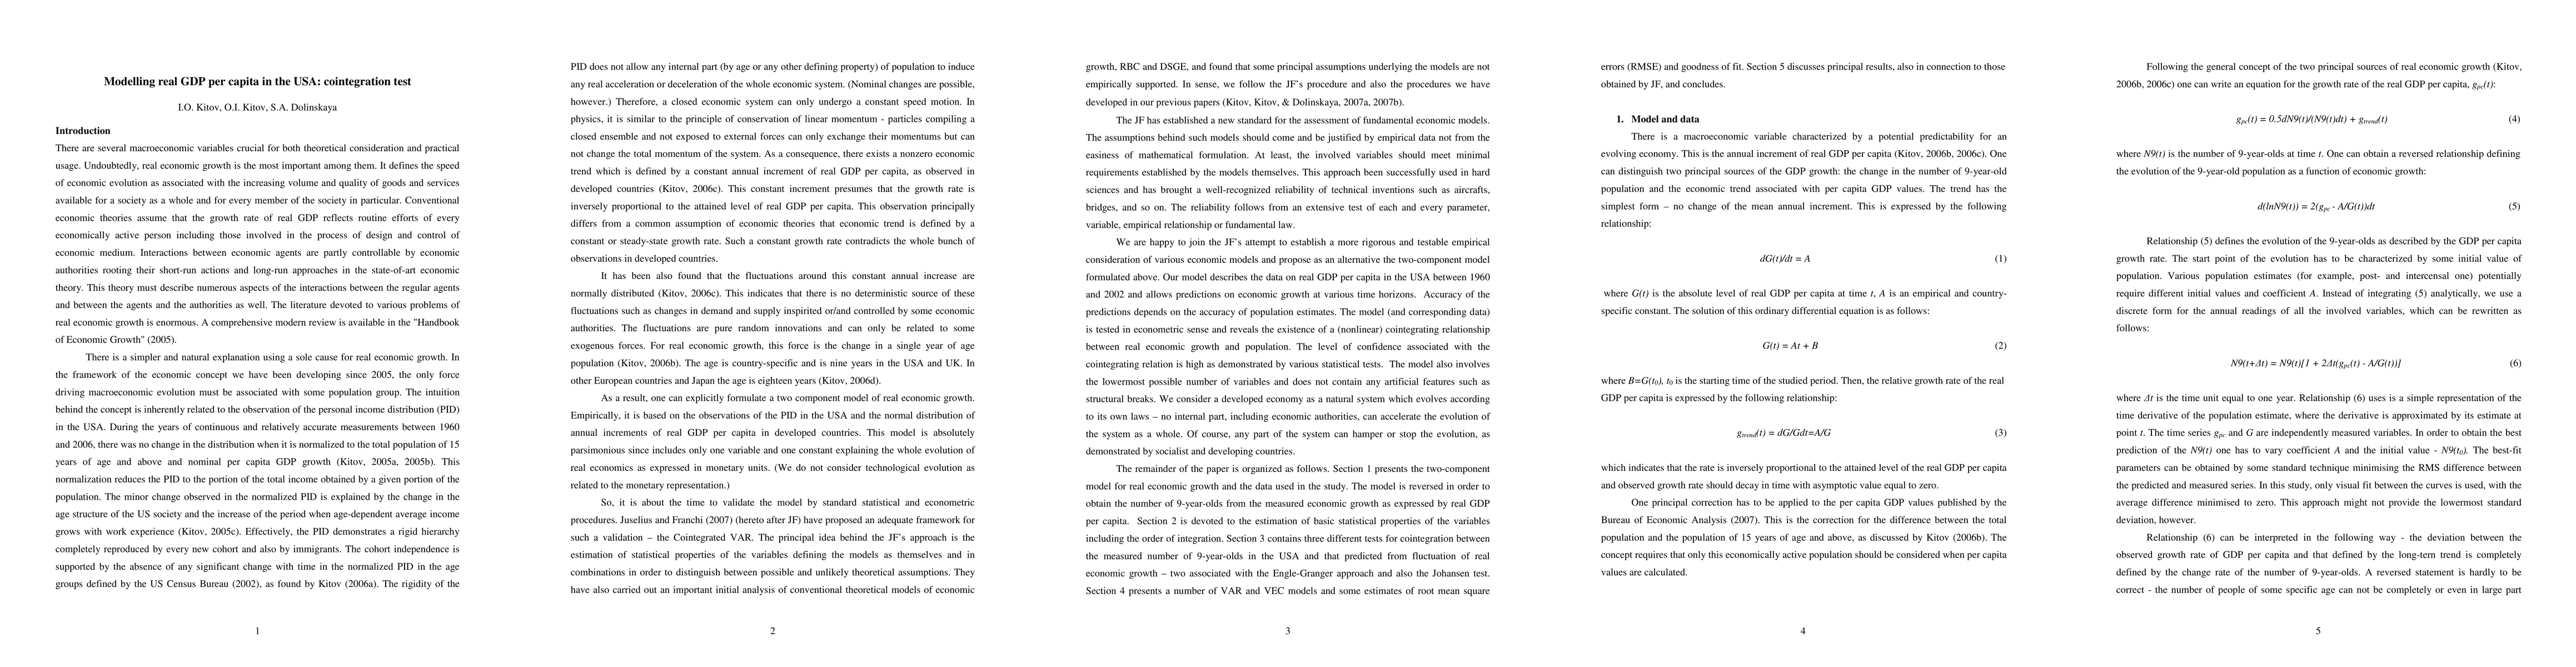
A two-component model for the evolution of real GDP per capita in the USA is presented and tested. The first component of the GDP growth rate represents an economic trend and is inversely proportional to the attained level of real GDP per capita itself, with the nominator being constant through time. The second component is responsible for fluctuations around the economic trend and is defined as a half of the growth rate of the number of 9-year-olds. This nonlinear relationship between the growth rate of real GDP per capita and the number of 9-year-olds in the USA is tested for cointegration. For linearization of the problem, a predicted population time series is calculated using the original relationship. Both single year of age population time series, the measured and predicted one, are shown to be integrated of order 1. The Engel-Granger approach is applied to the difference of the measured and predicted time series and to the residuals or corresponding linear regression. Both tests show the existence of a cointegrating relation. The Johansen test results in the cointegrating rank 1. Since a cointegrating relation between the measured and predicted number of 9-year-olds does exist, the VAR, VECM, and linear regression are used in estimation of the goodness of fit and root mean-square errors, RMSE. The highest R2=0.95 and the best RMSE is obtained in the VAR representation. Econometrically, the tests for cointegration show that the deviations of real economic growth in the USA from the economic trend, as defined by the constant annual increment of real per capita GDP, are driven by the change in the number of 9-year-olds.
AI Key Findings
Get AI-generated insights about this paper's methodology, results, significance, and more — seven facets brought into focus.
Impact
Paper Details
PDF Preview
Key Terms
Citation Network
Current paper (gray), citations (green), references (blue)
Display is limited for performance on very large graphs.
Discussion 0