Modelling Regional Crime Risk using Directed Graph of Check-ins
Publication
Metrics
Paper Preview
Abstract
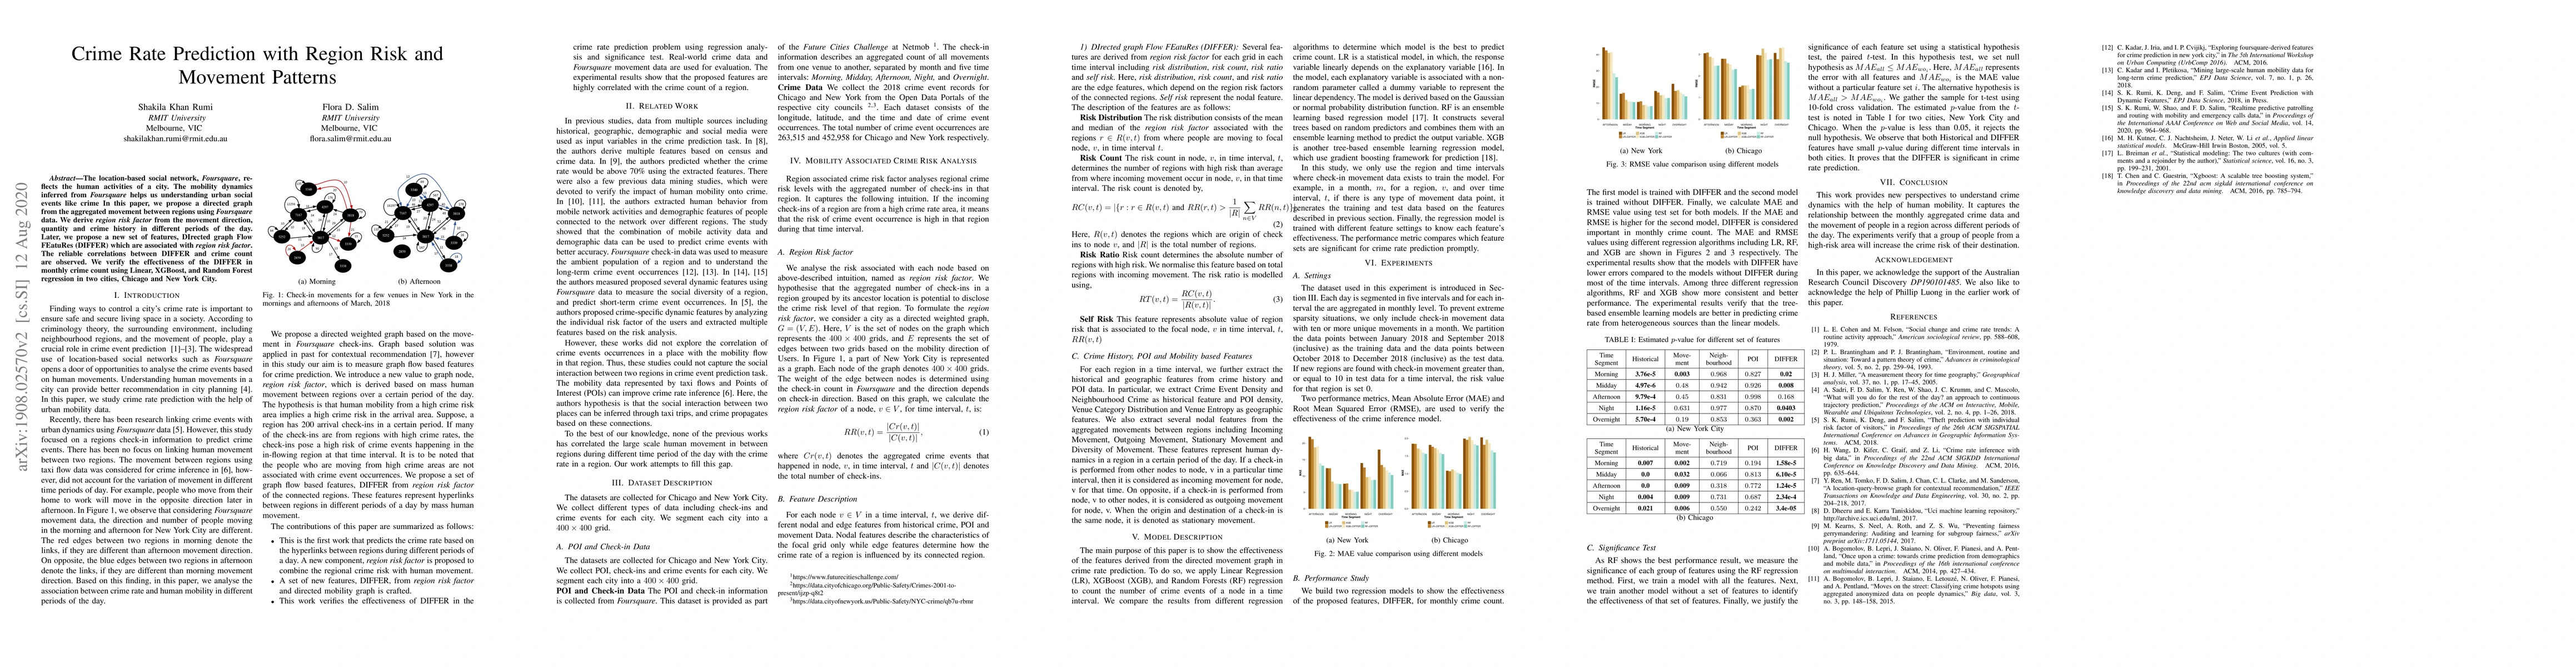
The location-based social network, Foursquare, reflects the human activities of a city. The mobility dynamics inferred from Foursquare helps us understanding urban social events like crime In this paper, we propose a directed graph from the aggregated movement between regions using Foursquare data. We derive region risk factor from the movement direction, quantity and crime history in different periods of the day. Later, we propose a new set of features, DIrected graph Flow FEatuRes (DIFFER) which are associated with region risk factor. The reliable correlations between DIFFER and crime count are observed. We verify the effectiveness of the DIFFER in monthly crime count using Linear, XGBoost, and Random Forest regression in two cities, Chicago and New York City.
AI Key Findings
Get AI-generated insights about this paper's methodology, results, significance, and more — seven facets brought into focus.
Impact
Paper Details
Authors
PDF Preview
Key Terms
Citation Network
Current paper (gray), citations (green), references (blue)
Display is limited for performance on very large graphs.
Discussion 0