Modelling the Dropout Patterns of MOOC Learners
Publication
Metrics
Paper Preview
Abstract
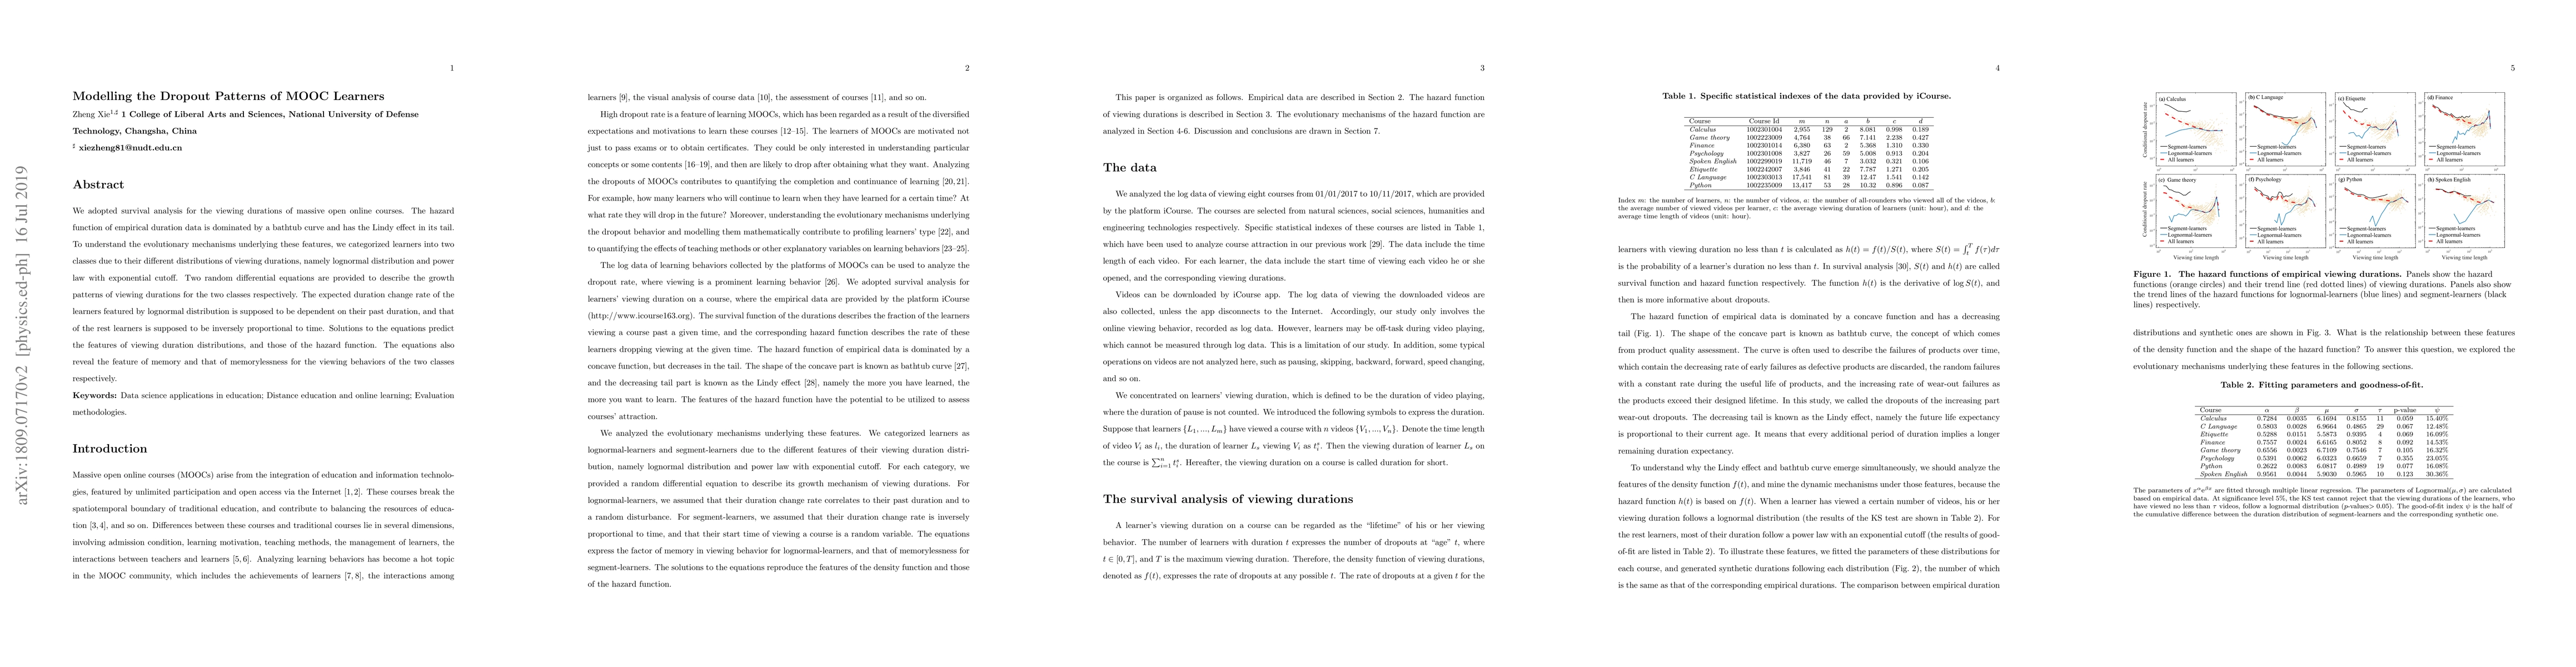
We adopted survival analysis for the viewing durations of massive open online courses. The hazard function of empirical duration data is dominated by a bathtub curve and has the Lindy effect in its tail. To understand the evolutionary mechanisms underlying these features, we categorized learners into two classes due to their different distributions of viewing durations, namely lognormal distribution and power law with exponential cutoff. Two random differential equations are provided to describe the growth patterns of viewing durations for the two classes respectively. The expected duration change rate of the learners featured by lognormal distribution is supposed to be dependent on their past duration, and that of the rest learners is supposed to be inversely proportional to time. Solutions to the equations predict the features of viewing duration distributions, and those of the hazard function. The equations also reveal the feature of memory and that of memorylessness for the viewing behaviors of the two classes respectively.
AI Key Findings
Get AI-generated insights about this paper's methodology, results, significance, and more — seven facets brought into focus.
Impact
Paper Details
PDF Preview
Key Terms
Citation Network
Current paper (gray), citations (green), references (blue)
Display is limited for performance on very large graphs.
Discussion 0