AI Quick Summary
This paper proposes "moldable exceptions" as a mechanism to tailor a debugger's interface using contextual information from raised exceptions, aiming to enhance debugging by providing domain-specific views and actions. The authors demonstrate how this approach can improve the debugging experience in a live programming environment.
Paper Preview
Abstract
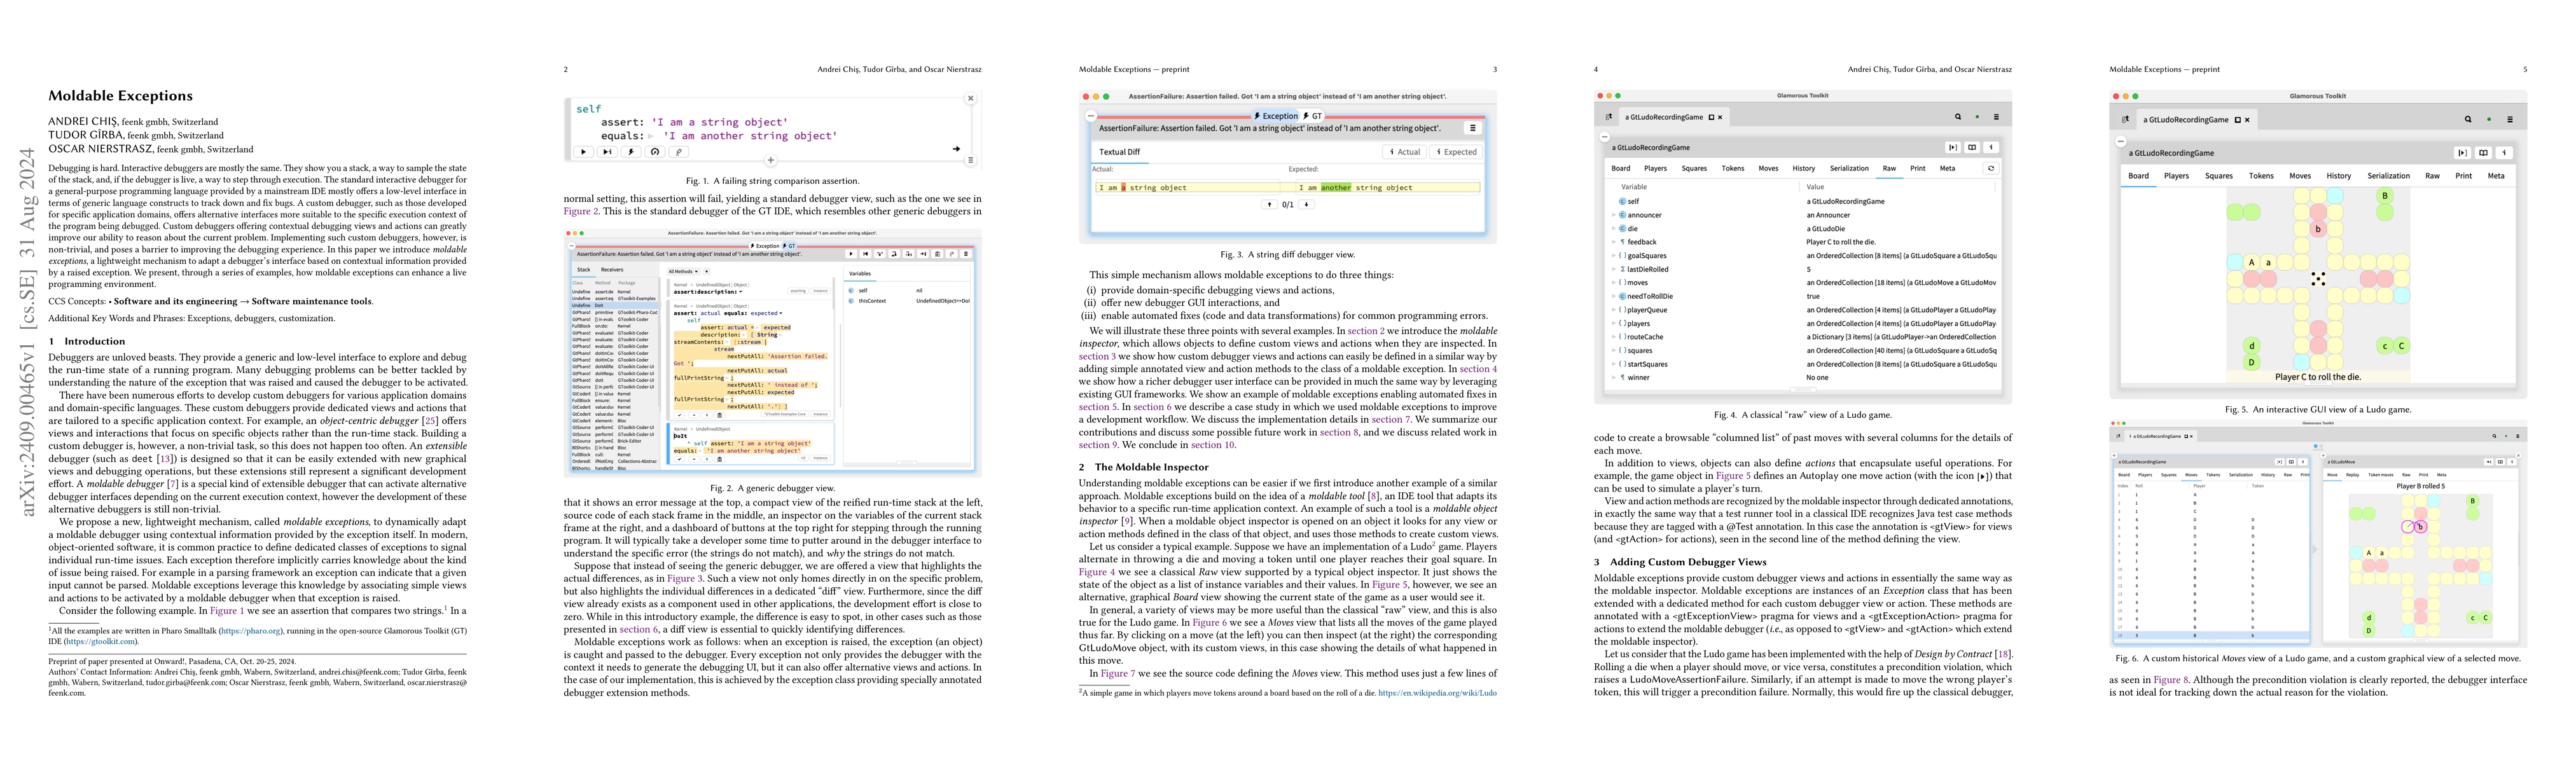
Debugging is hard. Interactive debuggers are mostly the same. They show you a stack, a way to sample the state of the stack, and, if the debugger is live, a way to step through execution. The standard interactive debugger for a general-purpose programming language provided by a mainstream IDE mostly offers a low-level interface in terms of generic language constructs to track down and fix bugs. A custom debugger, such as those developed for specific application domains, offers alternative interfaces more suitable to the specific execution context of the program being debugged. Custom debuggers offering contextual debugging views and actions can greatly improve our ability to reason about the current problem. Implementing such custom debuggers, however, is non-trivial, and poses a barrier to improving the debugging experience. In this paper we introduce "moldable exceptions", a lightweight mechanism to adapt a debugger's interface based on contextual information provided by a raised exception. We present, through a series of examples, how moldable exceptions can enhance a live programming environment.
AI Key Findings
Get AI-generated insights about this paper's methodology, results, and significance.
How to Cite This Paper
@article{chiş2024moldable,
  title         = {Moldable Exceptions},
  author        = {Chiş, Andrei and Nierstrasz, Oscar and Gîrba, Tudor},
  year          = {2024},
  eprint        = {2409.00465},
  archivePrefix = {arXiv},
  primaryClass  = {cs.SE},
  doi           = {10.1145/3689492.3690044},
}Chiş, A., Nierstrasz, O., & Gîrba, T. (2024). Moldable Exceptions. arXiv. https://doi.org/10.1145/3689492.3690044Chiş, Andrei, et al. "Moldable Exceptions." arXiv, 2024, doi.org/10.1145/3689492.3690044.PDF Preview
Citation Network
Current paper (gray), citations (green), references (blue)
Display is limited for performance on very large graphs.
Similar Papers
Found 4 papersNo citations found for this paper.
Comments (0)