Publication
Metrics
AI Quick Summary
This study investigates molecular gas and star formation in 76 HII regions across NGC 300 using CO observations and multi-wavelength imaging. The research finds a characteristic gas depletion time of 230 Myr, similar to Milky Way GMCs, and notes significant scatter in the star formation rate-molecular gas mass correlation, suggesting variability in cloud properties.
Paper Preview
Abstract
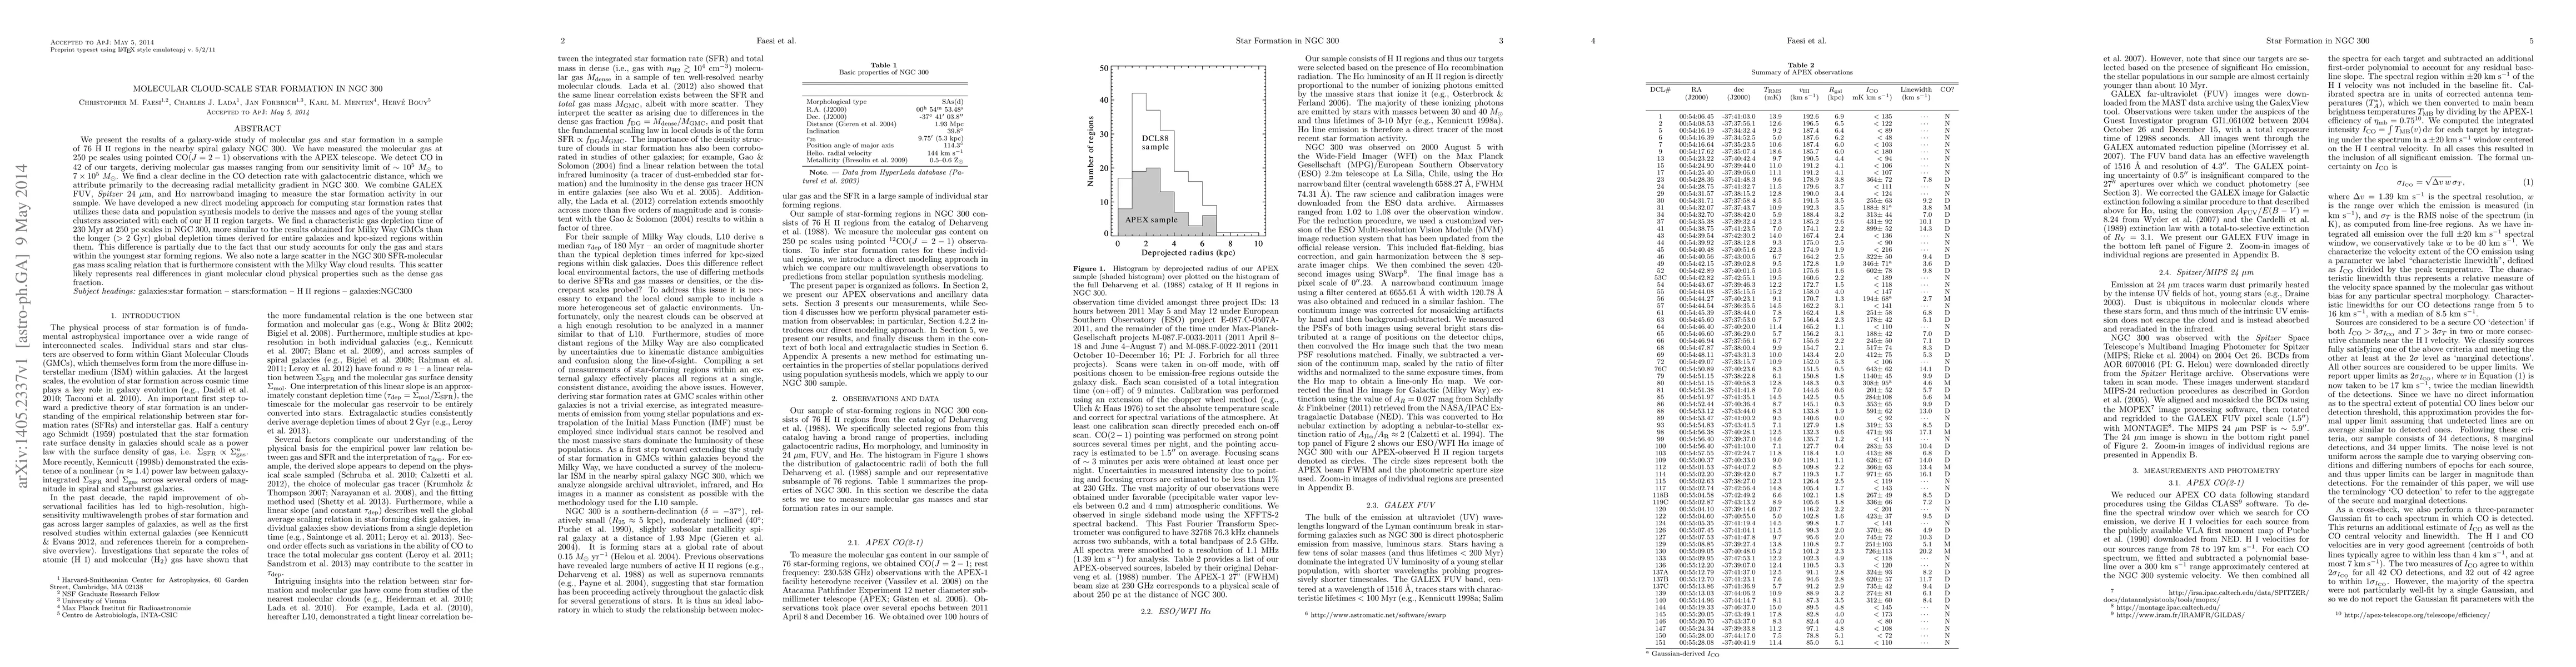
We present the results of a galaxy-wide study of molecular gas and star formation in a sample of 76 HII regions in the nearby spiral galaxy NGC 300. We have measured the molecular gas at 250 pc scales using pointed CO(J=2-1) observations with the APEX telescope. We detect CO in 42 of our targets, deriving molecular gas masses ranging from our sensitivity limit of ~10^5 Msun to 7x10^5 Msun. We find a clear decline in the CO detection rate with galactocentric distance, which we attribute primarily to the decreasing radial metallicity gradient in NGC 300. We combine GALEX FUV, Spitzer 24 micron, and H-alpha narrowband imaging to measure the star formation activity in our sample. We have developed a new direct modeling approach for computing star formation rates that utilizes these data and population synthesis models to derive the masses and ages of the young stellar clusters associated with each of our HII region targets. We find a characteristic gas depletion time of 230 Myr at 250 pc scales in NGC 300, more similar to the results obtained for Milky Way Giant Molecular Clouds than the longer (>2 Gyr) global depletion times derived for entire galaxies and kpc-sized regions within them. This difference is partially due to the fact that our study accounts for only the gas and stars within the youngest star forming regions. We also note a large scatter in the NGC 300 SFR-molecular gas mass scaling relation that is furthermore consistent with the Milky Way cloud results. This scatter likely represents real differences in giant molecular cloud physical properties such as the dense gas fraction.
AI Key Findings
Get AI-generated insights about this paper's methodology, results, significance, and more — seven facets brought into focus.
Impact
Paper Details
PDF Preview
Key Terms
Citation Network
Current paper (gray), citations (green), references (blue)
Display is limited for performance on very large graphs.
Discussion 0