Publication
Metrics
AI Quick Summary
This study detects molecular hydrogen emission in ten regions of the Large Magellanic Cloud using Spitzer IRS spectra, finding H$_2$ temperatures ranging from 86 to 137 K. The analysis reveals a strong correlation between H$_2$ emission and PAH/infrared emission, indicating photo-electric heating in photodissociation regions.
Paper Preview
Abstract
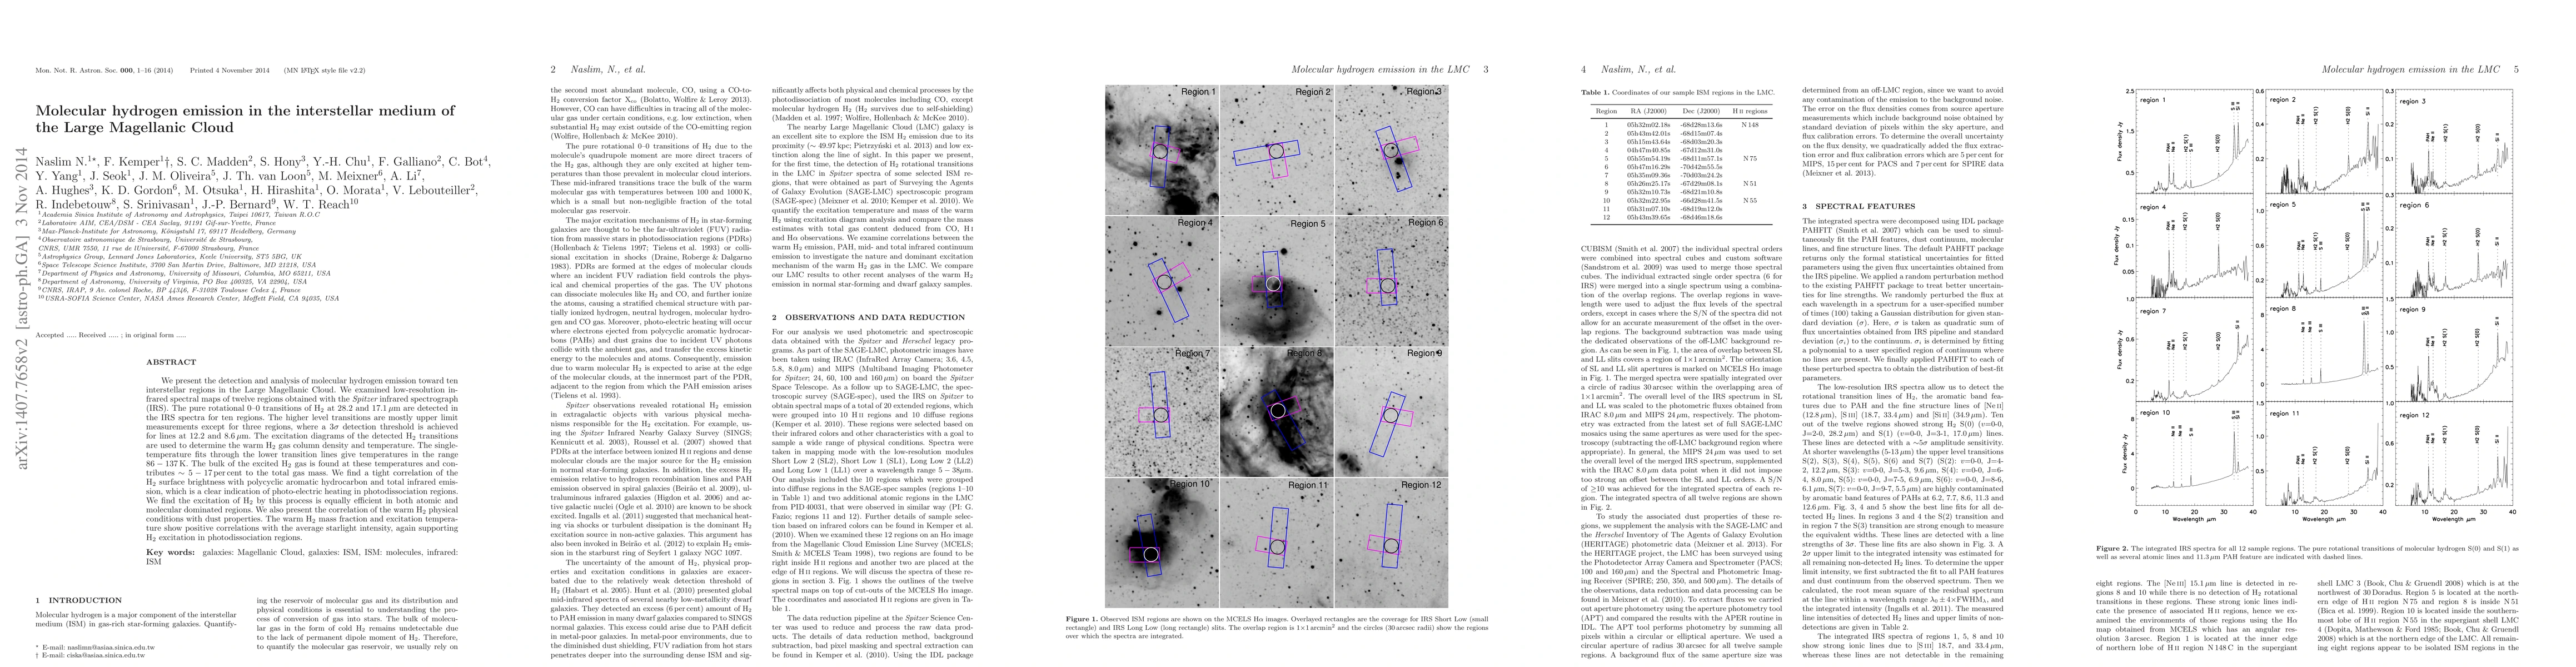
We present the detection and analysis of molecular hydrogen emission toward ten interstellar regions in the Large Magellanic Cloud. We examined low-resolution infrared spectral maps of twelve regions obtained with the Spitzer infrared spectrograph (IRS). The pure rotational 0--0 transitions of H$_2$ at 28.2 and 17.1${\,\rm \mu m}$ are detected in the IRS spectra for ten regions. The higher level transitions are mostly upper limit measurements except for three regions, where a 3$\sigma$ detection threshold is achieved for lines at 12.2 and 8.6${\,\rm \mu m}$. The excitation diagrams of the detected H$_2$ transitions are used to determine the warm H$_2$ gas column density and temperature. The single-temperature fits through the lower transition lines give temperatures in the range $86-137\,{\rm K}$. The bulk of the excited H$_2$ gas is found at these temperatures and contributes $\sim$5-17% to the total gas mass. We find a tight correlation of the H$_2$ surface brightness with polycyclic aromatic hydrocarbon and total infrared emission, which is a clear indication of photo-electric heating in photodissociation regions. We find the excitation of H$_2$ by this process is equally efficient in both atomic and molecular dominated regions. We also present the correlation of the warm H$_2$ physical conditions with dust properties. The warm H$_2$ mass fraction and excitation temperature show positive correlations with the average starlight intensity, again supporting H$_2$ excitation in photodissociation regions.
AI Key Findings
Get AI-generated insights about this paper's methodology, results, significance, and more — seven facets brought into focus.
Impact
Paper Details
PDF Preview
Key Terms
Citation Network
Current paper (gray), citations (green), references (blue)
Display is limited for performance on very large graphs.
Discussion 0