Publication
Metrics
AI Quick Summary
This paper proposes a Bayesian nonparametric model for estimating monotonically decreasing dose-response relationships, specifically using a novel Alamri Monotonic spline (AM-spline). The model addresses the constraints of the function being one at control dose and always positive, and is demonstrated through both simulated and real pesticide research data.
Paper Preview
Abstract
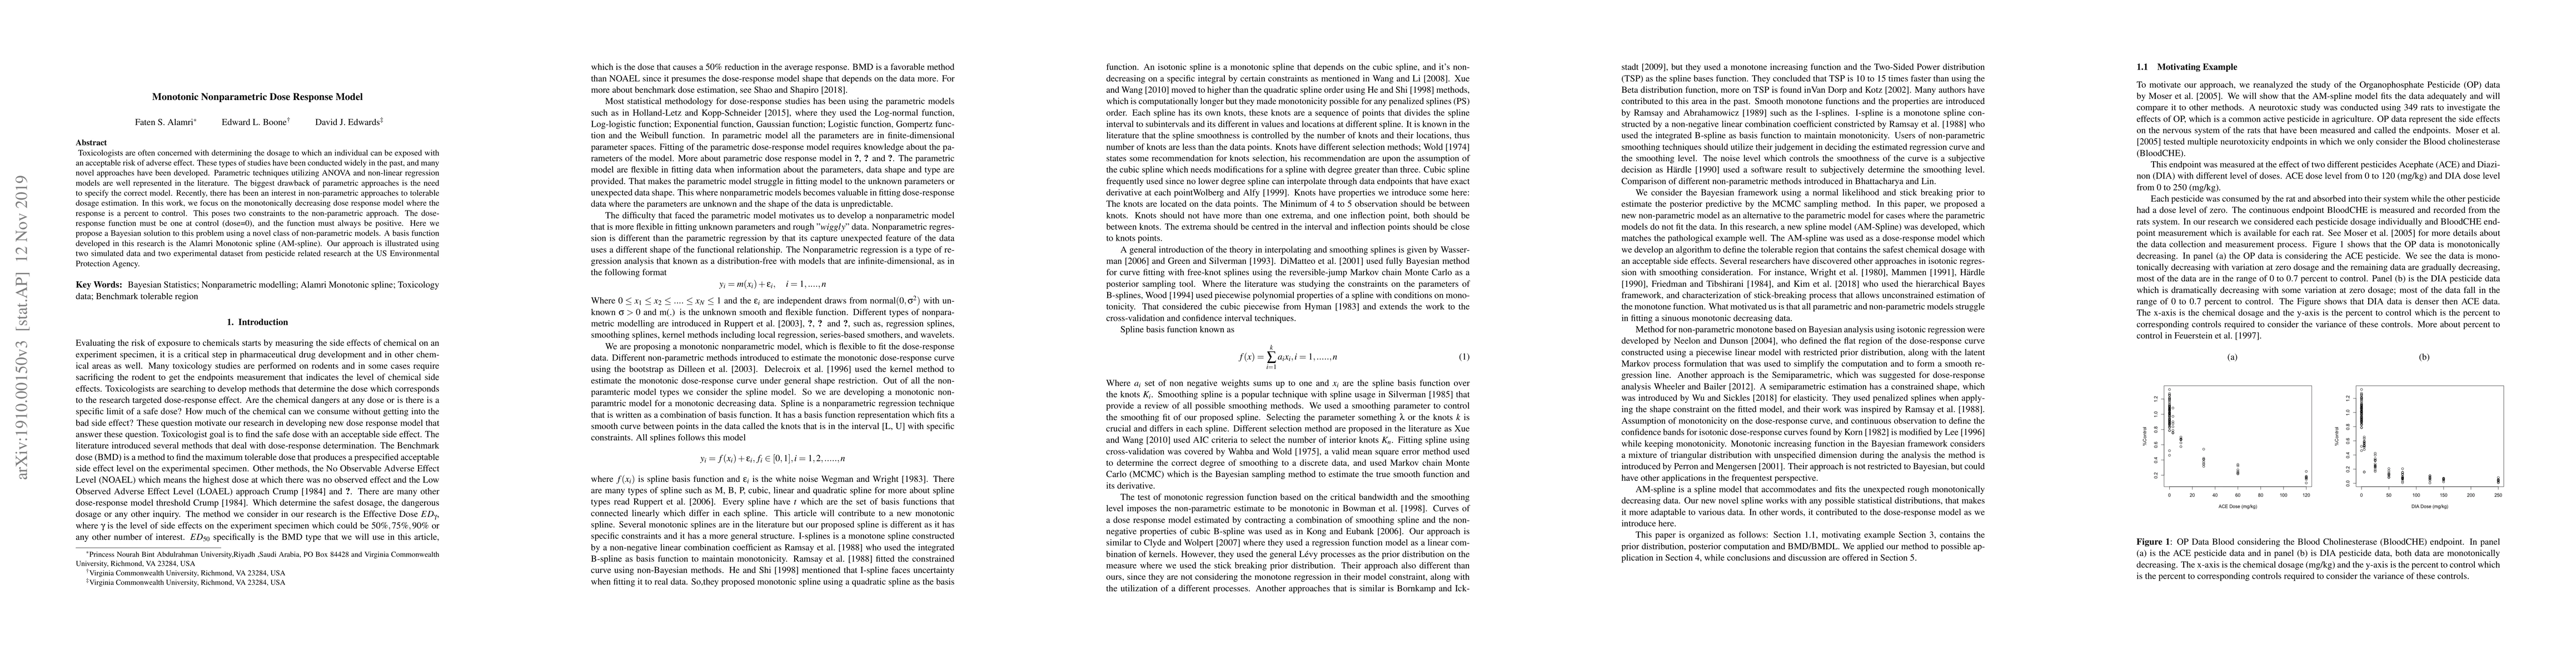
Toxicologists are often concerned with determining the dosage to which an individual can be exposed with an acceptable risk of adverse effect. These types of studies have been conducted widely in the past, and many novel approaches have been developed. Parametric techniques utilizing ANOVA and nonlinear regression models are well represented in the literature. The biggest drawback of parametric approaches is the need to specify the correct model. Recently, there has been an interest in nonparametric approaches to tolerable dosage estimation. In this work, we focus on the monotonically decreasing dose response model where the response is a percent to control. This poses two constraints to the nonparametric approach. The doseresponse function must be one at control (dose = 0), and the function must always be positive. Here we propose a Bayesian solution to this problem using a novel class of nonparametric models. A basis function developed in this research is the Alamri Monotonic spline (AM-spline). Our approach is illustrated using both simulated data and an experimental dataset from pesticide related research at the US Environmental Protection Agency.
AI Key Findings
Get AI-generated insights about this paper's methodology, results, significance, and more — seven facets brought into focus.
Impact
Paper Details
Authors
PDF Preview
Key Terms
Citation Network
Current paper (gray), citations (green), references (blue)
Display is limited for performance on very large graphs.
Discussion 0