Publication
Metrics
AI Quick Summary
The paper proposes MSG-Chart, a multimodal scene graph for ChartQA to explicitly represent relationships between chart elements and their data patterns. The graph enhances understanding by integrating visual and textual graph representations, improving performance on ChartQA benchmarks.
Paper Preview
Abstract
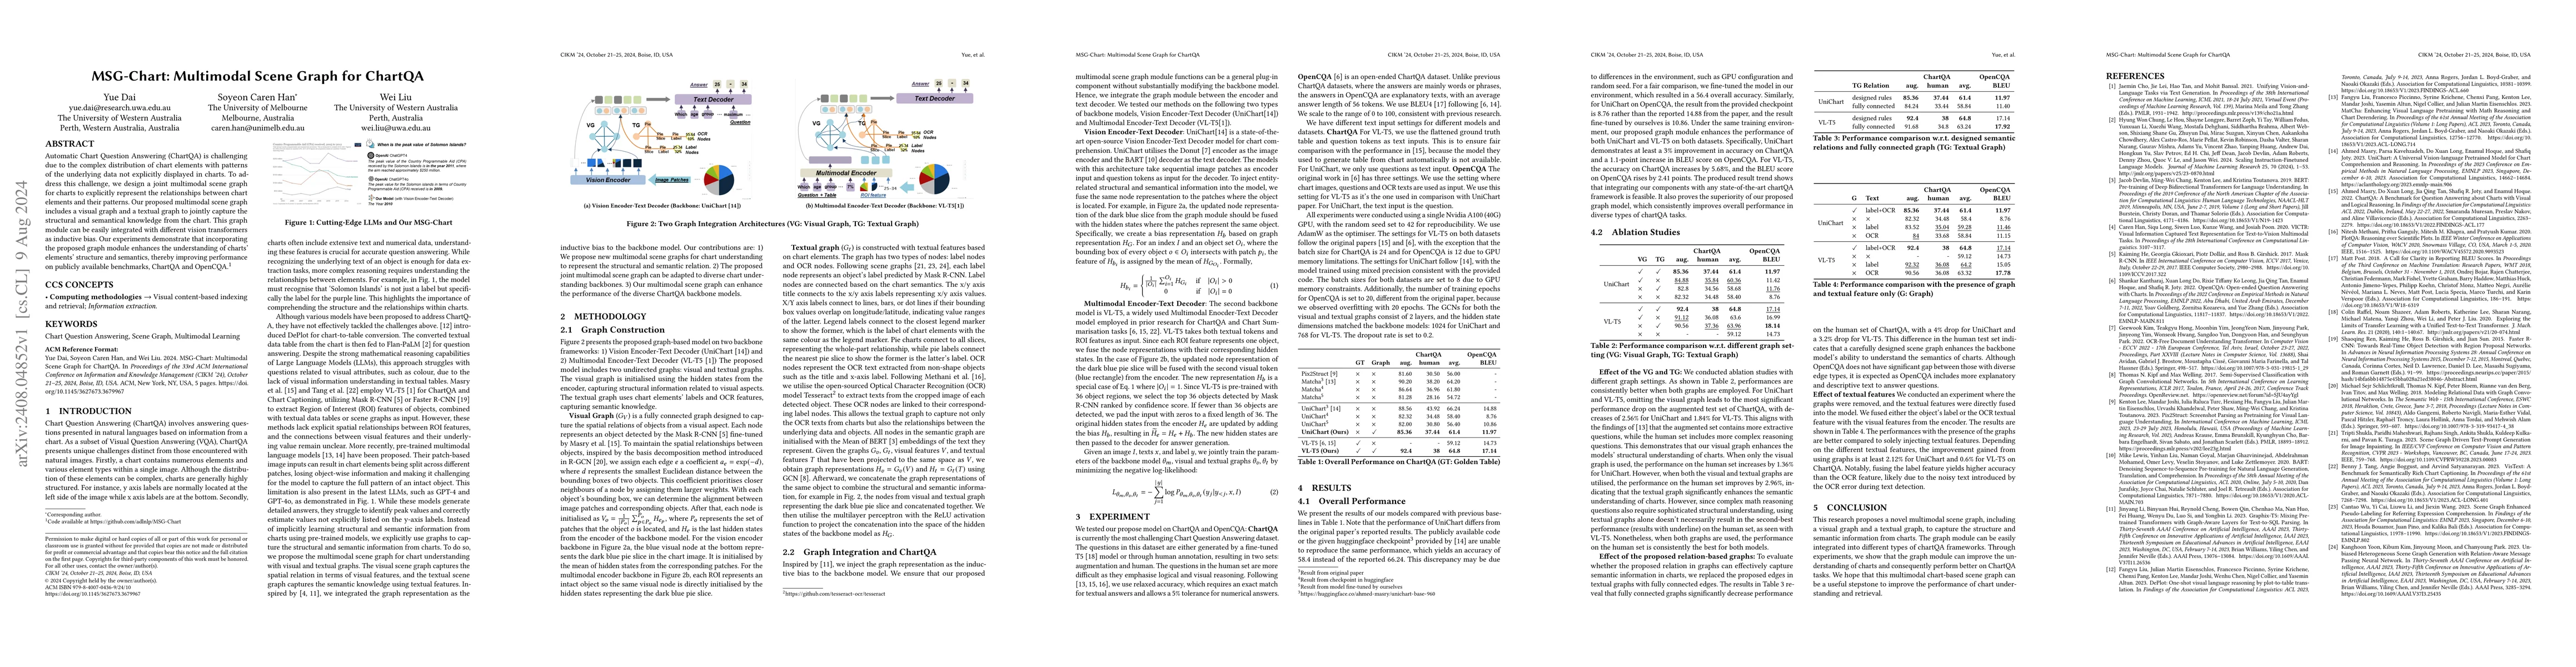
Automatic Chart Question Answering (ChartQA) is challenging due to the complex distribution of chart elements with patterns of the underlying data not explicitly displayed in charts. To address this challenge, we design a joint multimodal scene graph for charts to explicitly represent the relationships between chart elements and their patterns. Our proposed multimodal scene graph includes a visual graph and a textual graph to jointly capture the structural and semantical knowledge from the chart. This graph module can be easily integrated with different vision transformers as inductive bias. Our experiments demonstrate that incorporating the proposed graph module enhances the understanding of charts' elements' structure and semantics, thereby improving performance on publicly available benchmarks, ChartQA and OpenCQA.
AI Key Findings
Get AI-generated insights about this paper's methodology, results, significance, and more — seven facets brought into focus.
Impact
Paper Details
Authors
PDF Preview
Citation Network
Current paper (gray), citations (green), references (blue)
Display is limited for performance on very large graphs.
Discussion 0