MTV: Visual Analytics for Detecting, Investigating, and Annotating Anomalies in Multivariate Time Series
Publication
Metrics
AI Quick Summary
This paper introduces MTV, a visual analytics system designed to aid in detecting and investigating anomalies in multivariate time series data, emphasizing human-AI collaboration. Through expert feedback and user studies, it demonstrates the system's effectiveness in supporting efficient anomaly detection and annotation in industrial contexts.
Paper Preview
Abstract
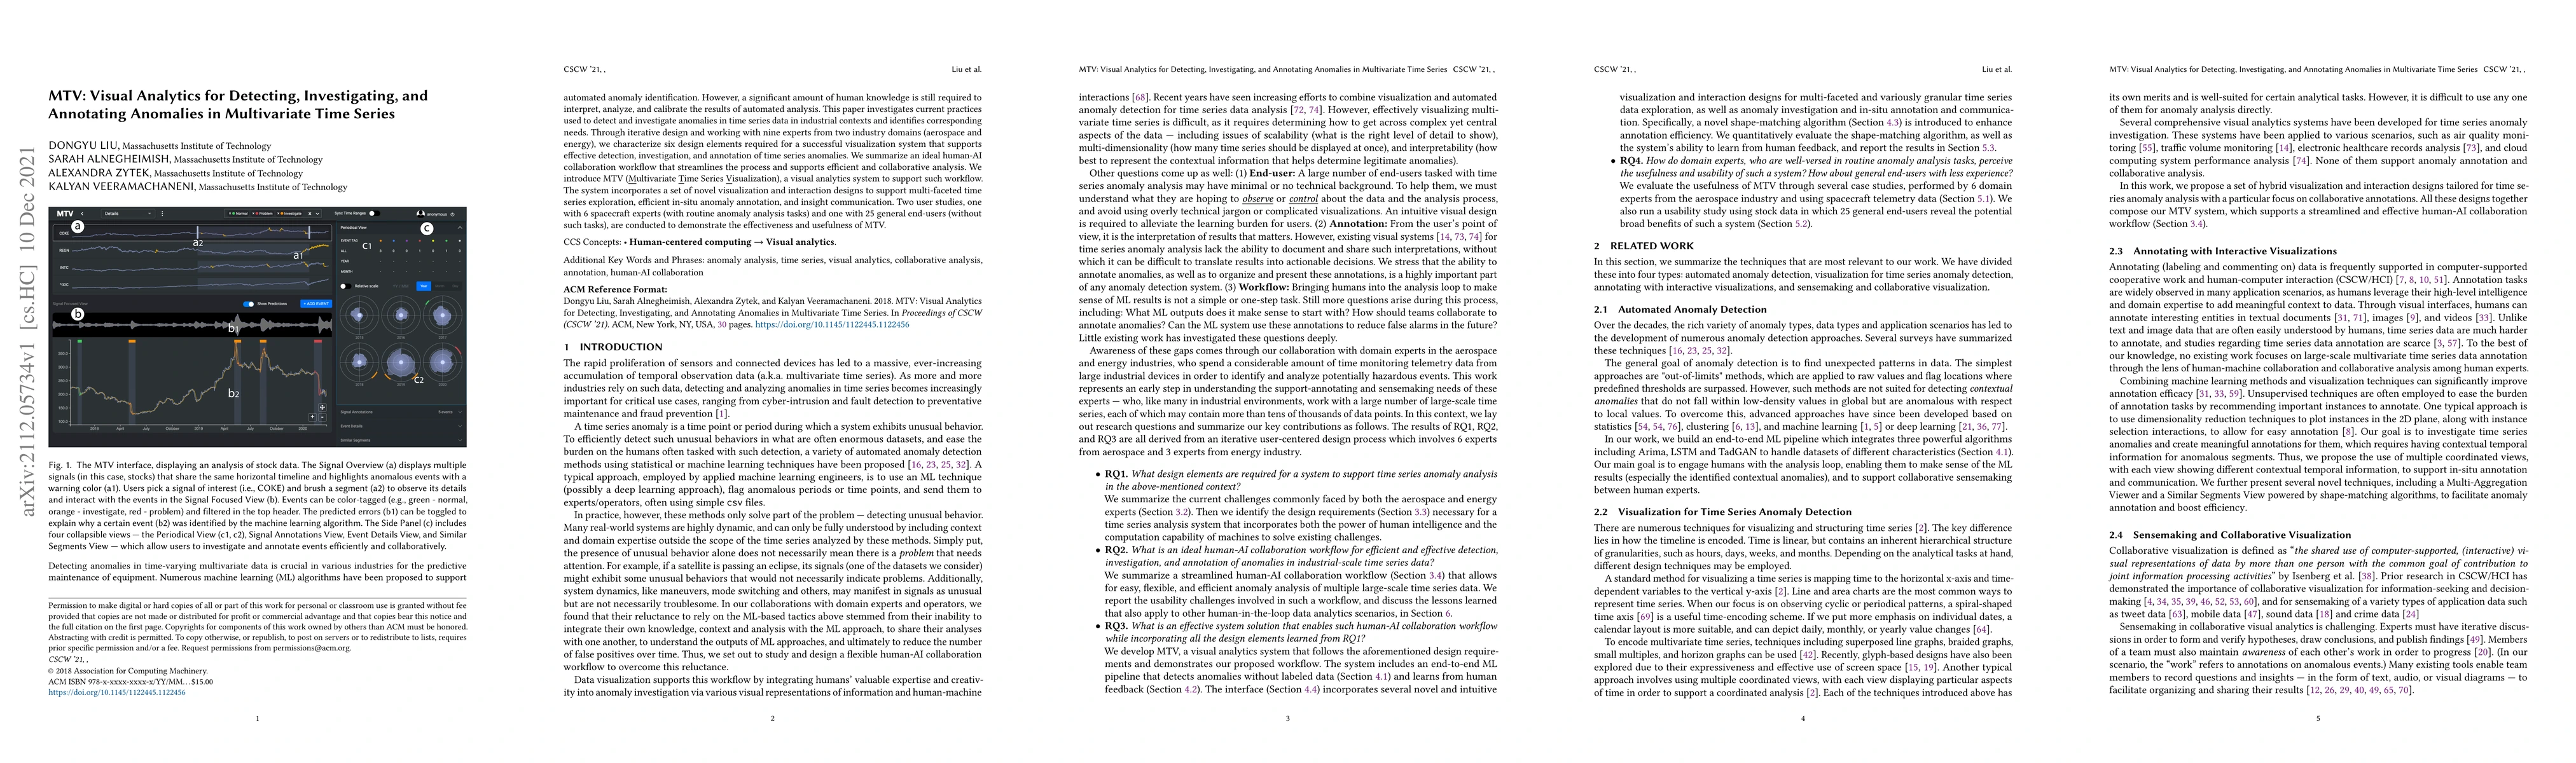
Detecting anomalies in time-varying multivariate data is crucial in various industries for the predictive maintenance of equipment. Numerous machine learning (ML) algorithms have been proposed to support automated anomaly identification. However, a significant amount of human knowledge is still required to interpret, analyze, and calibrate the results of automated analysis. This paper investigates current practices used to detect and investigate anomalies in time series data in industrial contexts and identifies corresponding needs. Through iterative design and working with nine experts from two industry domains (aerospace and energy), we characterize six design elements required for a successful visualization system that supports effective detection, investigation, and annotation of time series anomalies. We summarize an ideal human-AI collaboration workflow that streamlines the process and supports efficient and collaborative analysis. We introduce MTV (Multivariate Time Series Visualization), a visual analytics system to support such workflow. The system incorporates a set of novel visualization and interaction designs to support multi-faceted time series exploration, efficient in-situ anomaly annotation, and insight communication. Two user studies, one with 6 spacecraft experts (with routine anomaly analysis tasks) and one with 25 general end-users (without such tasks), are conducted to demonstrate the effectiveness and usefulness of MTV.
AI Key Findings
Get AI-generated insights about this paper's methodology, results, significance, and more — seven facets brought into focus.
Impact
Paper Details
Authors
PDF Preview
Key Terms
Citation Network
Current paper (gray), citations (green), references (blue)
Display is limited for performance on very large graphs.
Discussion 0