Summary
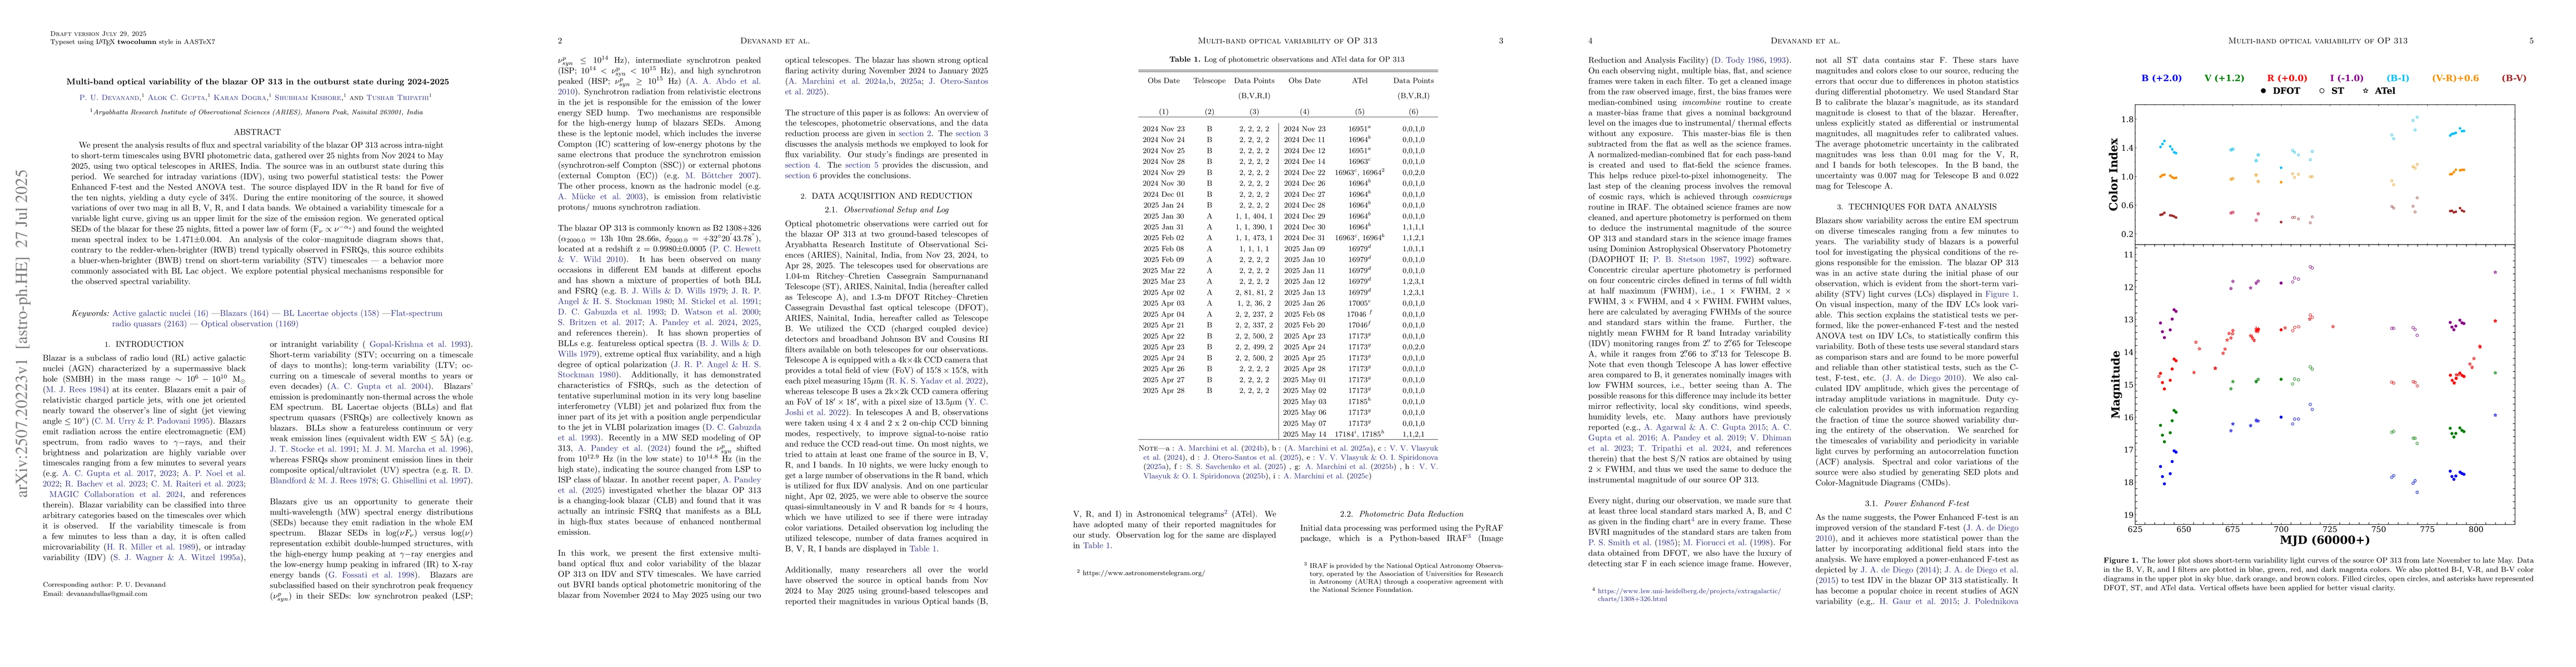
We present the analysis results of flux and spectral variability of the blazar OP 313 across intra-night to short-term timescales using BVRI photometric data, gathered over 25 nights from Nov 2024 to May 2025, using two optical telescopes in ARIES, India. The source was in an outburst state during this period. We searched for intraday variations (IDV), using two powerful statistical tests: the Power Enhanced F-test and the Nested ANOVA test. The source displayed IDV in the R band for five of the ten nights, yielding a duty cycle of 34$\%$. During the entire monitoring of the source, it showed variations of over two mag in all B, V, R, and I data bands. We obtained a variability timescale for a variable light curve, giving us an upper limit for the size of the emission region. We generated optical SEDs of the blazar for these 25 nights, fitted a power law of form $(F_\nu \propto \nu^{-\alpha_{o}})$ and found the weighted mean spectral index to be 1.471$\pm$0.004. An analysis of the color-magnitude diagram shows that, contrary to the redder-when-brighter (RWB) trend typically observed in FSRQs, this source exhibits a bluer-when-brighter (BWB) trend on short-term variability (STV) timescales - a behavior more commonly associated with BL Lac object. We explore potential physical mechanisms responsible for the observed spectral variability.
AI Key Findings
Get AI-generated insights about this paper's methodology, results, and significance.
Paper Details
PDF Preview
Citation Network
Current paper (gray), citations (green), references (blue)
Display is limited for performance on very large graphs.
Similar Papers
Found 4 papersMulti-band intra-night variability of the blazar CTA 102 during its 2016 December outburst
B. M. Mihov, L. S. Slavcheva-Mihova
A Unified Multi-Wavelength Data Analysis Workflow with gammapy. Constraining the Broadband Emission of FSRQ OP 313
D. Morcuende, M. Nievas Rosillo, J. Otero-Santos et al.
No citations found for this paper.
Comments (0)